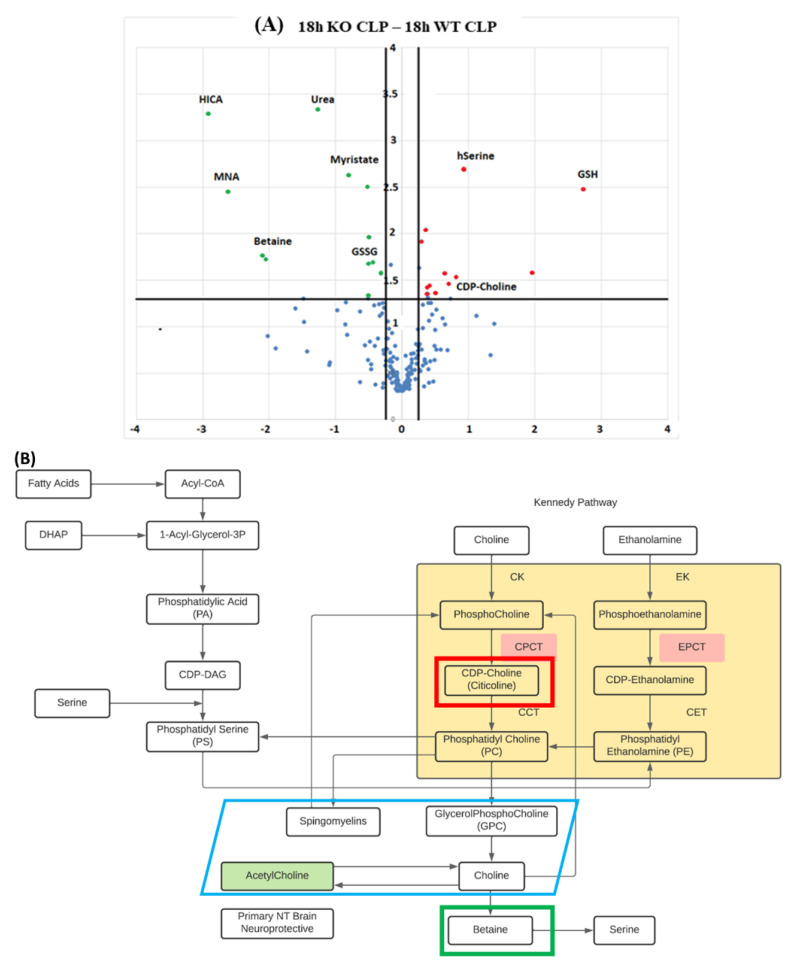
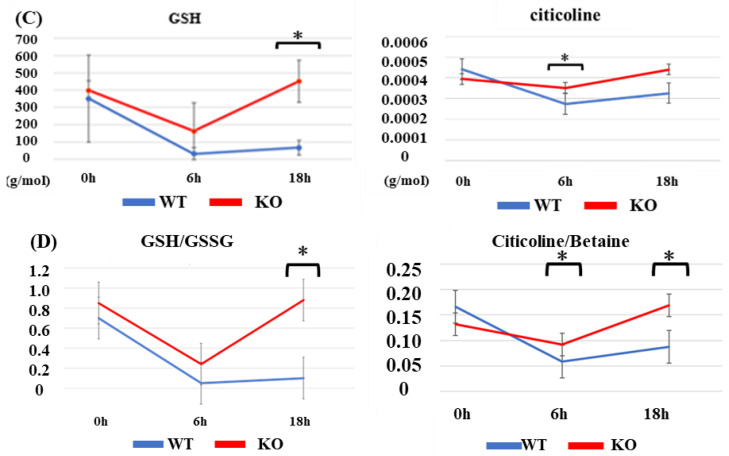
Figure 4.
Metabolomics of brain tissue following CLP. (A) Volcano plot for differential brain tissue metabolite expression 18 h following induction of sepsis in CypD KO vs. WT mice. Scattered points represent individual metabolites: the x-axis is the Log 2 (fold change) for the ratio KO-CLP-18 h vs. WT-CLP-18 h, whereas the y-axis is the Log (p-value), where p-value is the probability that a metabolite has statistical significance in its differential expression. Red dots are, thus, metabolites significantly over-expressed in KO-CLP-18 h, and green dots are metabolites significantly underexpressed in KO-CLP-18 h vs. WT-CLP-18 h. (B) CDP-Choline/citicoline and betaine were intermediaries related to the Kennedy pathway of phosphatidylcholine synthesis. The KO group maintained a higher brain GSH value than the WT group at all timepoints (0, 6, and 18 h), which was statistically significant at 18 h. (C) Citicoline was also maintained at a high level in the KO group at 6 and 18 h after CLP. (D) Focusing on the redox effect and calculating the ratio of GSH to GSSG or the ratio of citicoline to betaine, both ratios were maintained at a higher level in the KO group. Data are expressed as means ± SD, * p < 0.05, n = 3.


