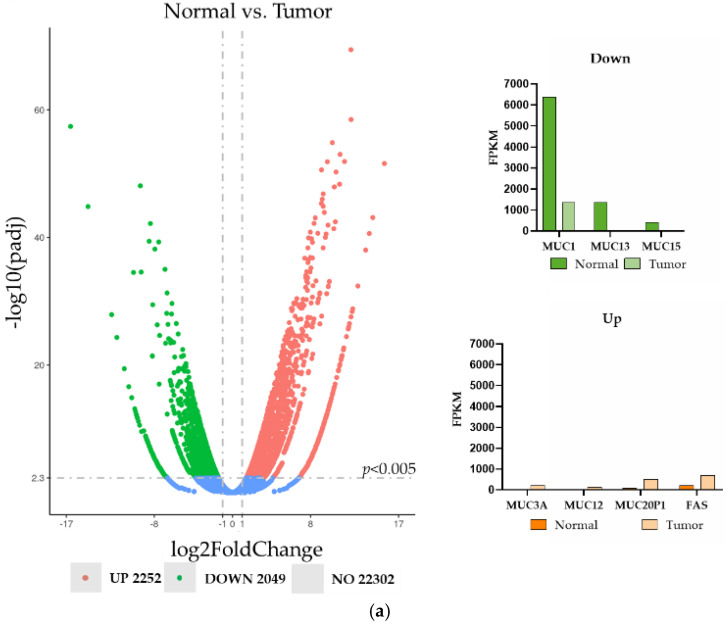
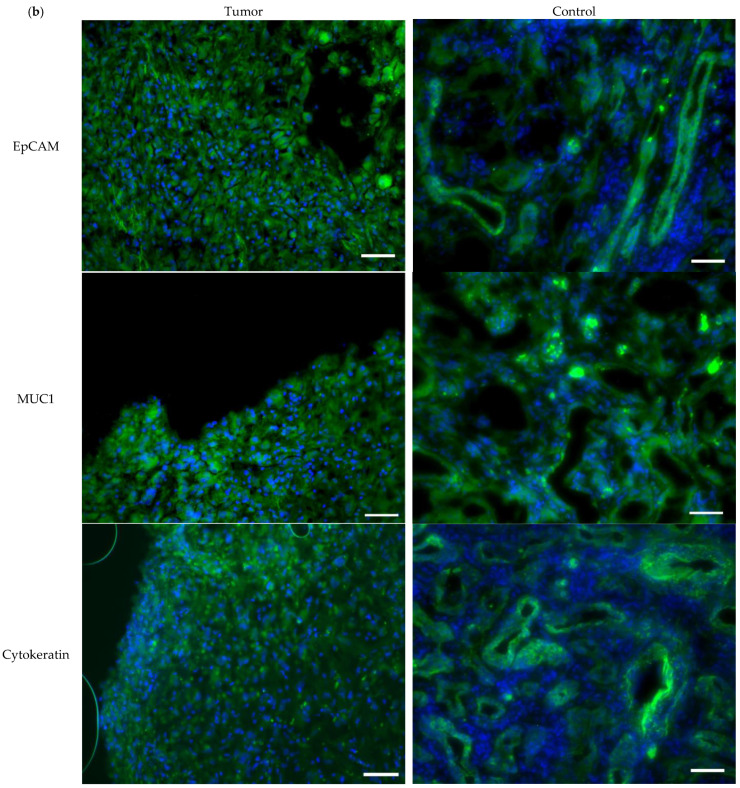
Figure 2.
The expression analysis of the renal normal and tumor tissues. (a) The transcriptome microarray analysis with a detailed description of the differentially expressed surface proteins; FPKM—Fragments Per Kilobase Million; (b) the protein expression of EpCAM, MUC1 and cytokeratin (green) in the clear cell renal tumor (pT3b) and corresponding control tissues. The nuclei were stained with Hoechst (blue).


