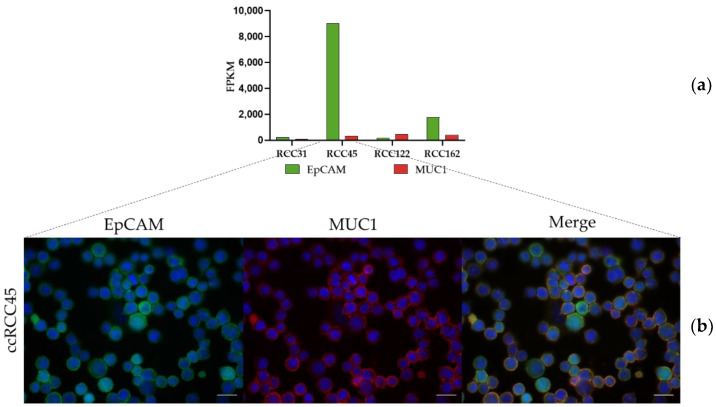
Figure 3.
The surface markers in the primary ccRCC cell lines. (a) The transcriptome microarray analysis with a detailed description of EpCAM and MUC1 in ccRCC31, ccRCC45, ccRCC122 and ccRCC162; FPKM—Fragments Per Kilobase Million, (b) the localization of EpCAM (green) and MUC1 (red) proteins on the surface of the ccRCC45 separate cells and merged cells to visualize the colocalization. The images show protein localization. The nuclei were stained with Hoechst (blue).

