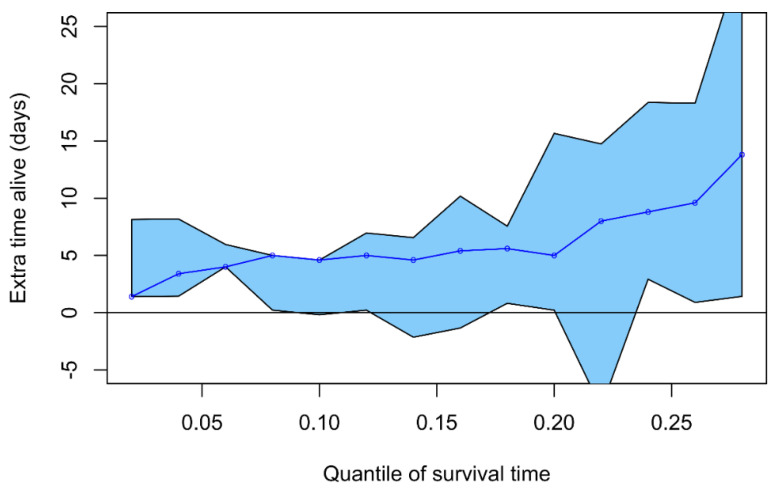
Figure 3.
The QTE analysis of the CITRIS-ALI trial. The horizontal axis shows the quantile of survival. The vertical axis shows the difference in the life span between the vitamin C and placebo groups on the same quantile. The blue line shows the QTE estimate and the shaded region shows its 95% CI. This QTE analysis was carried out with the cqr program of the quantreg package of R [131]. The extraction of the CITRIS-ALI trial data has been described previously [116]. See Listing S4 for the calculation in the Supplementary Materials.

