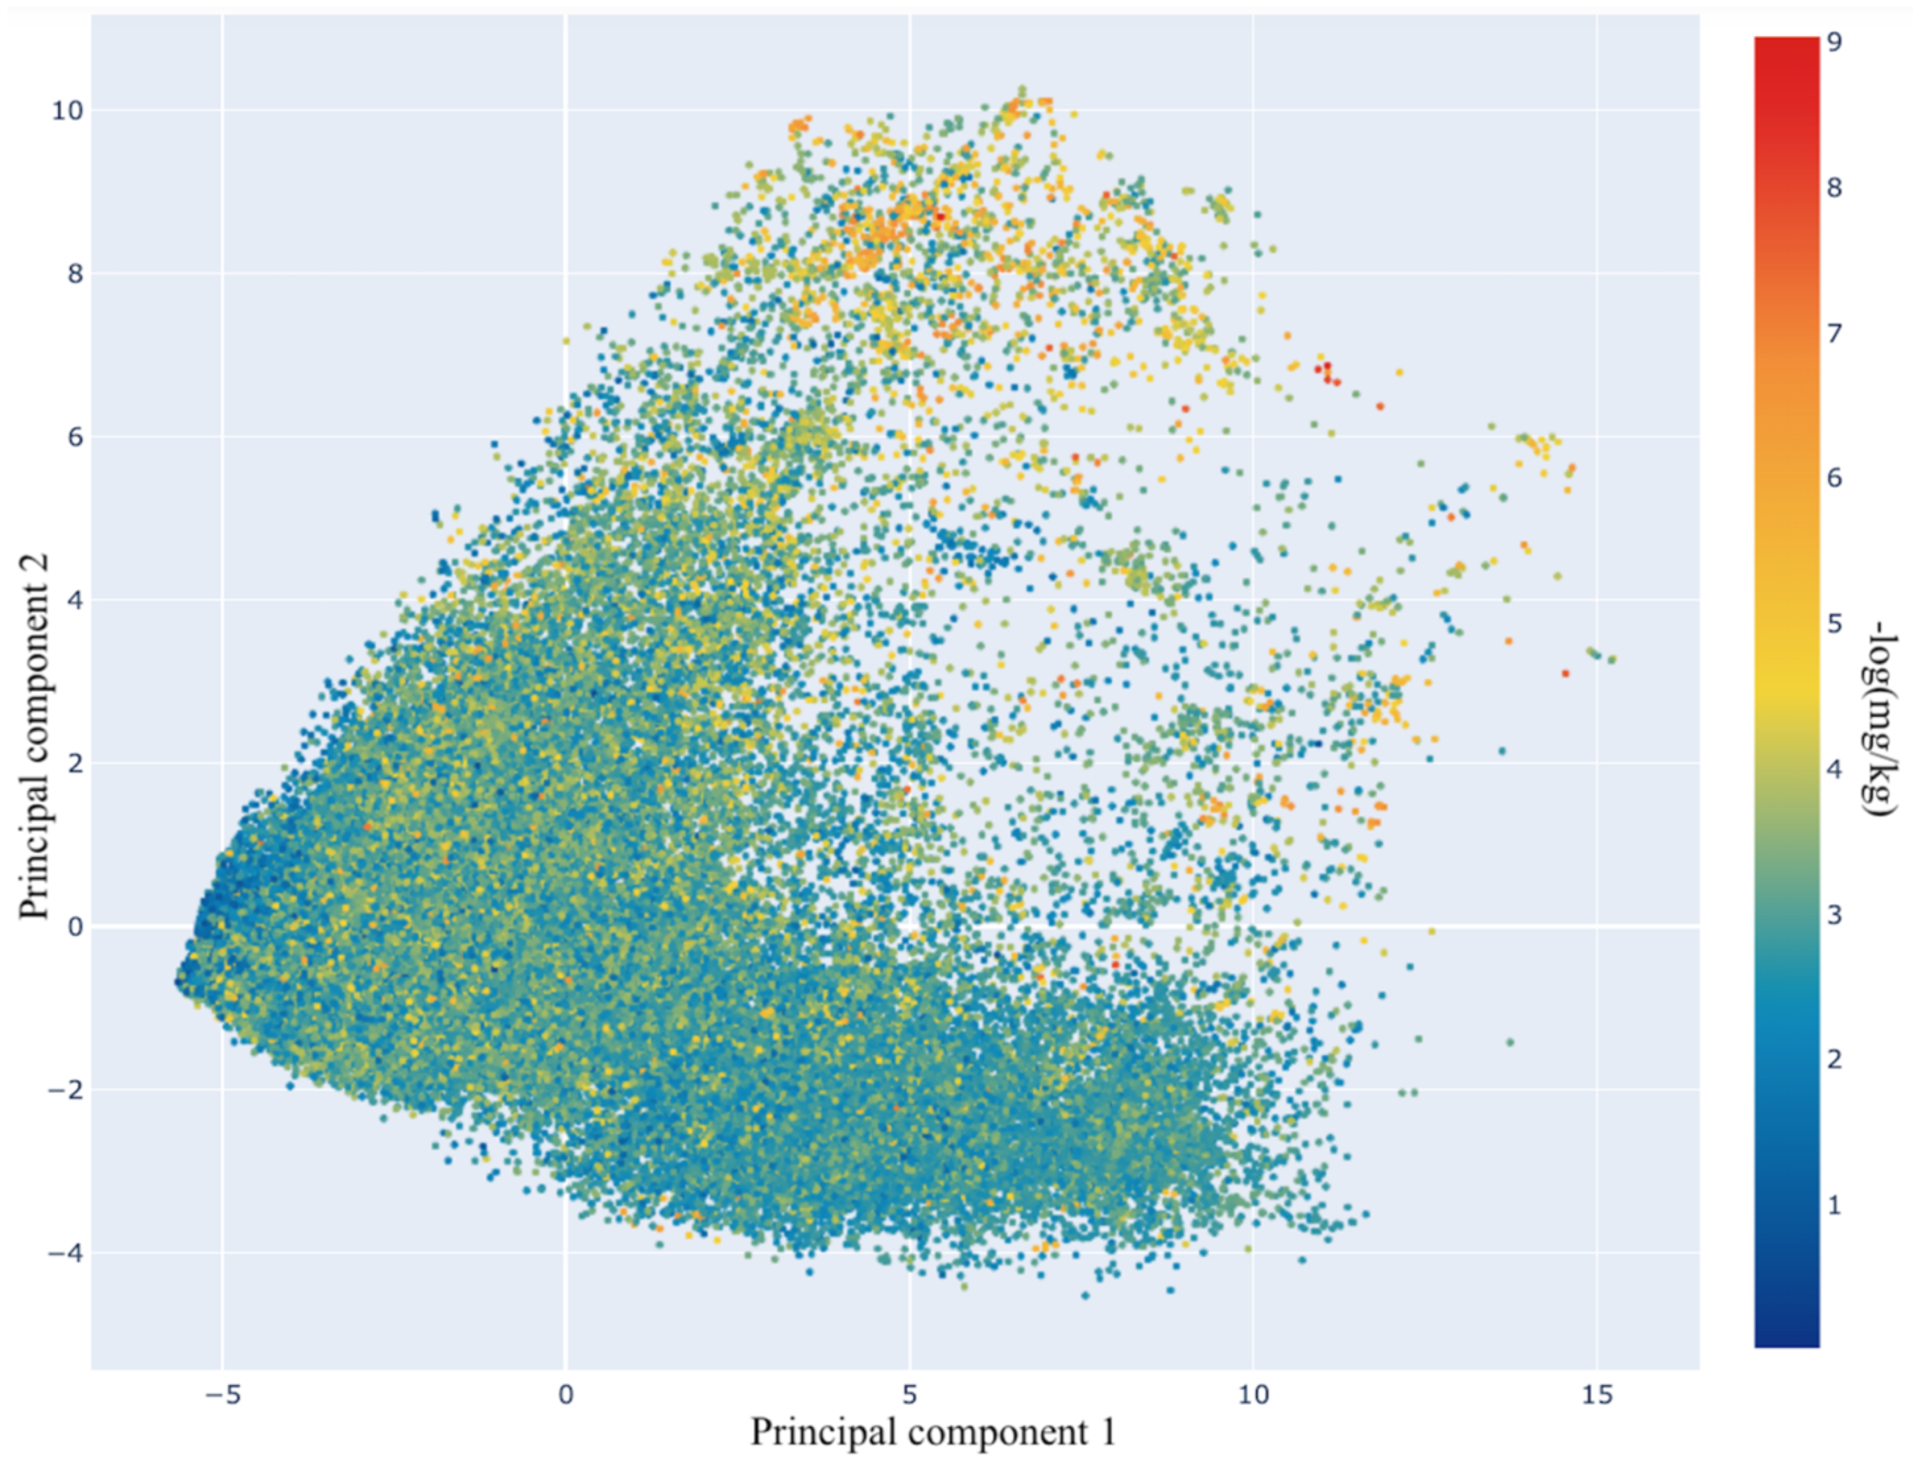
Figure 1.

Two-dimensional PCA plot for the complete dataset based on Avalon fingerprints. The color scale represents the median toxicity value of the compounds against different endpoints in −log(mol/kg), i.e., the higher the values, the more toxic the compounds.
