Figure 4.

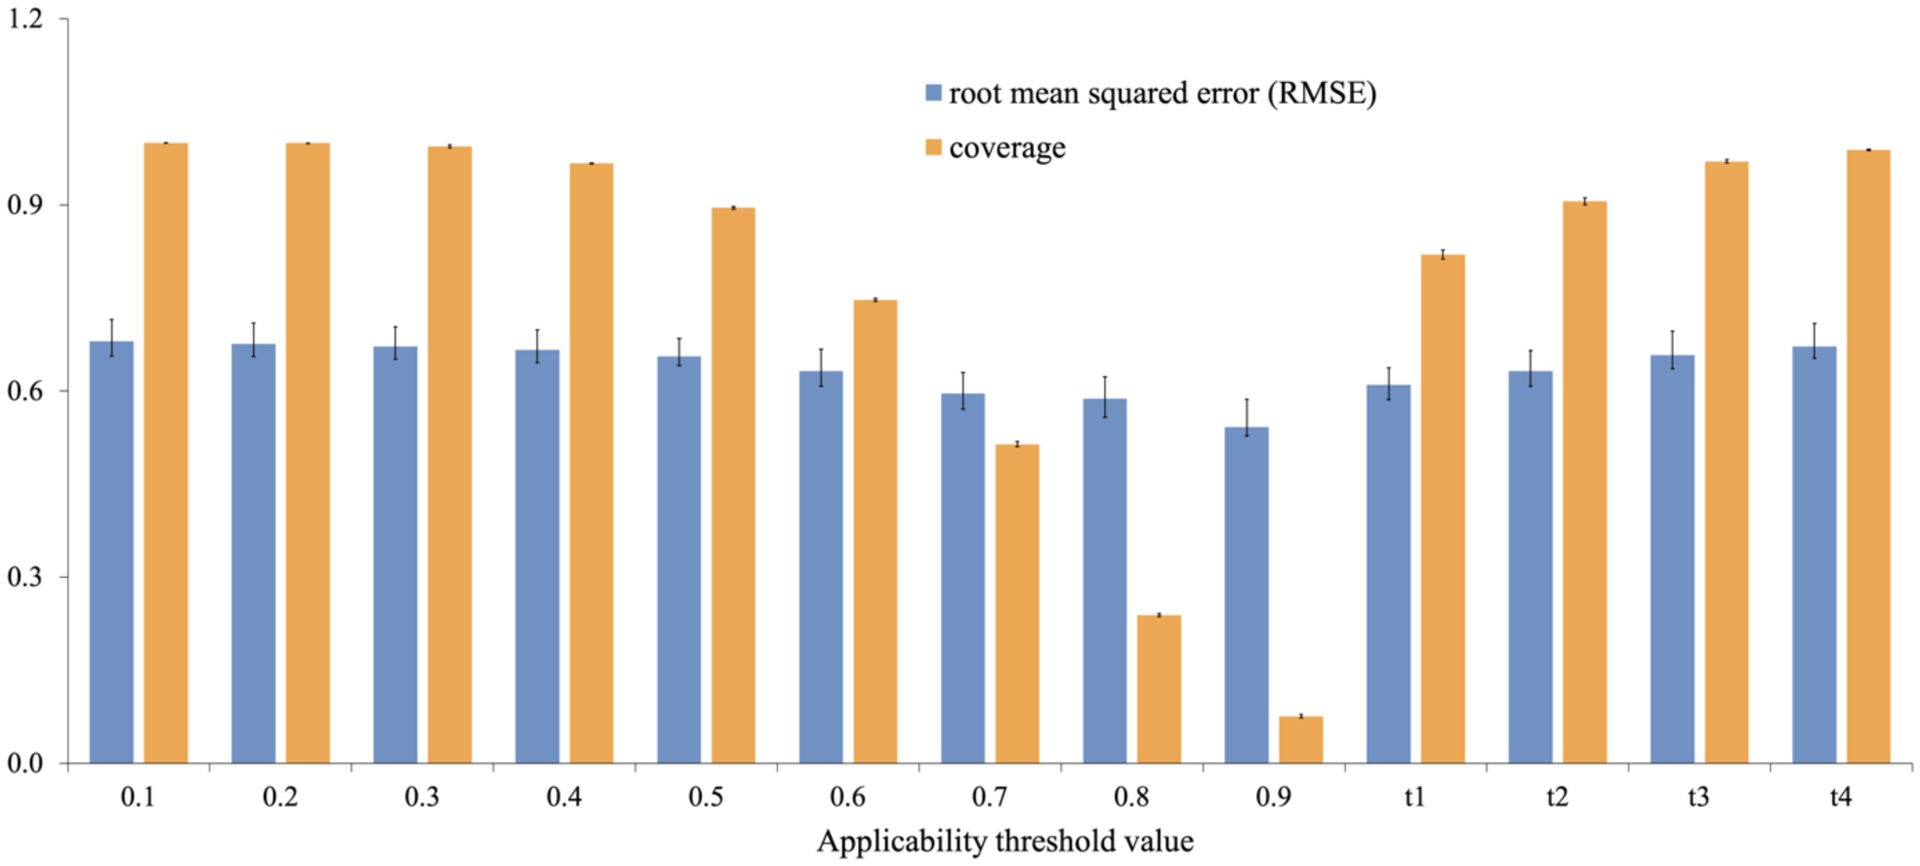
Distribution of the DLCA prediction results (RMSE) and coverage values over AD (0.1–0.9) and SD (t1–t4) cut-offs. The error bar represents the standard deviation of the average performance over five-folds.

Distribution of the DLCA prediction results (RMSE) and coverage values over AD (0.1–0.9) and SD (t1–t4) cut-offs. The error bar represents the standard deviation of the average performance over five-folds.