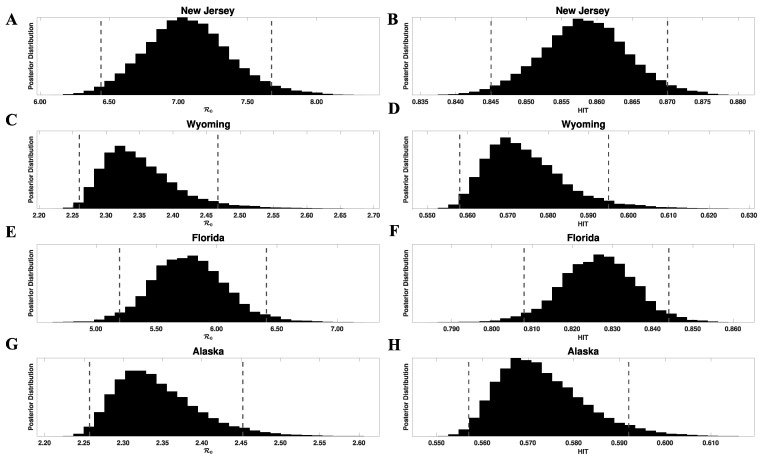
Figure 2.
Marginal posterior distributions of (left panels) and HIT (right panels) for ancestral strains of SARS-CoV-2 in four US states: (A,B) New Jersey, (C,D) Wyoming, (E,F) Florida, and (G,H) Alaska. Inferences are based on daily reports of new cases from 21 January to 21 June 2020. Each posterior was obtained from the corresponding marginal posterior for and Equation (1). Each HIT posterior was obtained from the relation and the corresponding marginal posterior for . The 95% credible intervals for are as follows: (6.44, 7.67) for New Jersey, (2.26, 2.47) for Wyoming, (5.20, 6.41) for Florida, and (2.26, 2.45) for Alaska. The 95% credible intervals for the HIT estimates are as follows: (0.84, 0.87) for New Jersey, (0.56, 0.59) for Wyoming, (0.81, 0.84) for Florida, and (0.56, 0.59) for Alaska. For each panel, the endpoints of the corresponding credible interval are indicated with vertical broken lines.

