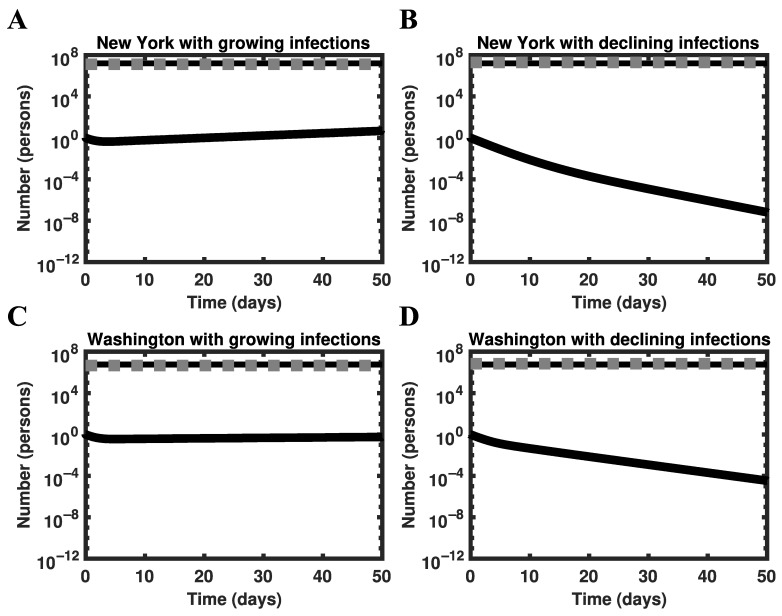
Figure 6.
Perturbation analysis using the full model of Lin et al. [22] for the states of New York (panels (A,B)) and Washington (panels (C,D)). In each panel, the black solid line represents the number of infectious persons (initially 1), the black broken line represents the threshold number of persons required for herd immunity (i.e., ), and the gray broken line represents the number of recovered persons (initially , obtained as described in Results). Simulations are based on MAP estimates for model parameters obtained using surveillance data collected from 21 January to 21 June 2020.

