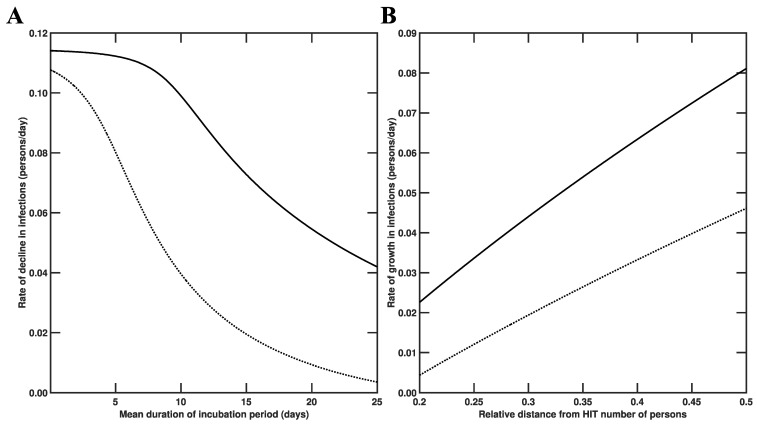
Figure 7.
Dependence of disease burden on key model parameters for the states of New York and Washington. In each panel, the solid line corresponds to New York and the broken line corresponds to Washington. In Panel (A), rate of decline in infections is plotted as a function of the mean duration of the incubation period (in days), which is obtained as , where is the number of stages in the incubation period and characterizes disease progression from one stage to the next. We take as in the study of Lin et al. [22]. In Panel (B), the rate of growth in infections is plotted as a function of the relative distance from the herd immunity threshold number of persons, which is defined as .

