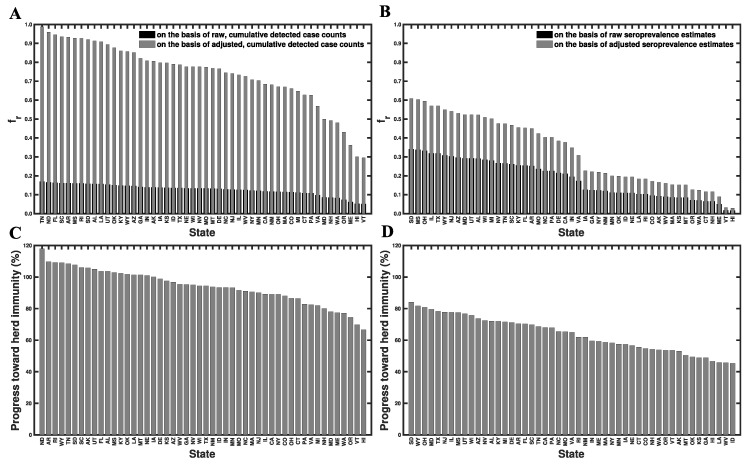
Figure 8.
Percent progress toward herd immunity in each of the 50 US states. Percent progress indicates the fraction of immune persons required for herd immunity. was calculated using Equation (2). Black bars (Panel (A)) correspond to the first scenario (i.e., estimated as the number of detected cases divided by population size), gray bars (Panels (A,C)) correspond to the second scenario (i.e., estimated as the number of detected cases within a population divided by the population size, adjusted for lack of detection of undiagnosed SARS-CoV-2 infections), black bars (Panel (B)) correspond to the third scenario (i.e., given by seroprevalence survey results), and gray bars (Panels (B,D)) correspond to the fourth scenario (i.e., given by seroprevalence survey results adjusted for lack of detection of asymptomatic cases). Estimates for are sorted by state from largest to smallest values according to the second scenario (Panels (A,C)) and the fourth scenario (Panels (B,D)). North Dakota was omitted from Panels (B,D) because a recent estimate of seroprevalence was not available at Ref. [25]. States are indicated using two-letter US postal service state abbreviations (https://about.usps.com/who-we-are/postal-history/state-abbreviations.pdf (accessed on 19 September 2021)).

