Figure 1.
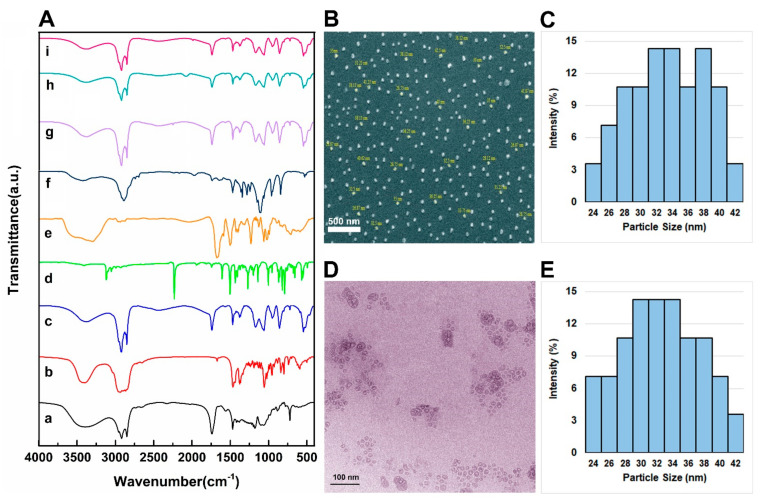
(A) FTIR spectra of different niosomal formulations and their component including (a) Span 60, (b) cholesterol, (c) unloaded niosomes, NL, (d) Let, (e) Cyclo, (f) folic acid, (g) niosomal Let, (h) niosomal Cyclo, and (i) NLCPFA; (B) FE-SEM image of NLCPFA; (C) average particle size and particle size distributions obtained by SEM image with an average of 33.8 nm; (D) TEM images of NLCPFA; (E) particle size and distributions by TEM images with an average of 27.9 nm.

