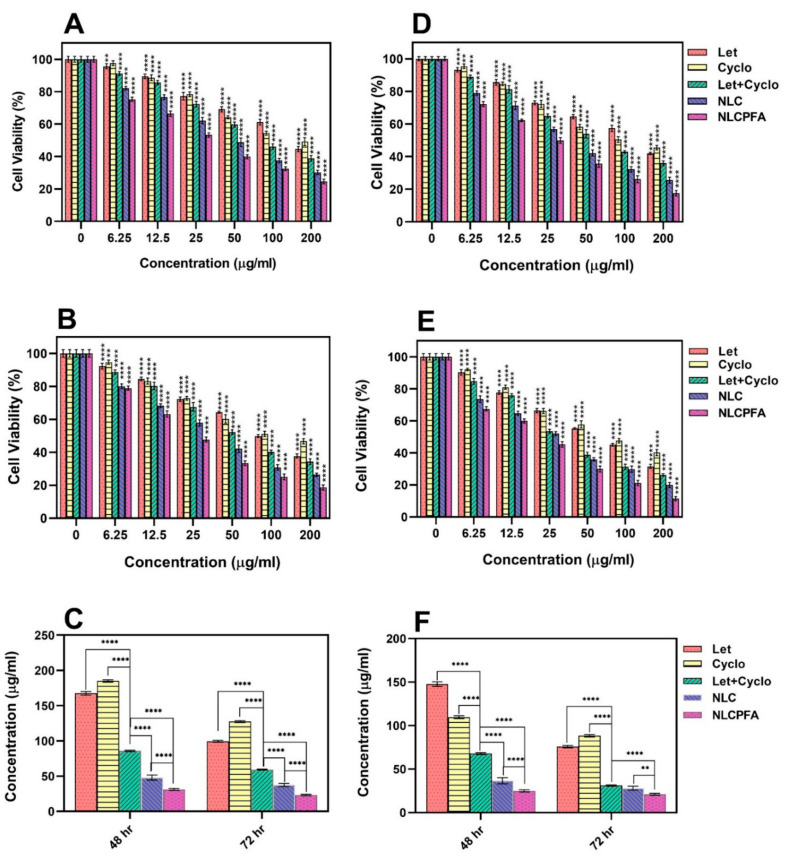
Figure 3.
Cytotoxicity effect analysis of MDA-MB-231 (A–C) and SKBR3 (D–F) cell lines against different fabricated niosomal and non-niosomal formulation treatments in 48 h (A,D) and 72 h (B,E) by various concentration and calculated IC50 concentrations by linear interpolation of each sample for MDA-MB-231 (C) and SKBR3 (F) ** p < 0.01, and **** p < 0.0001).

