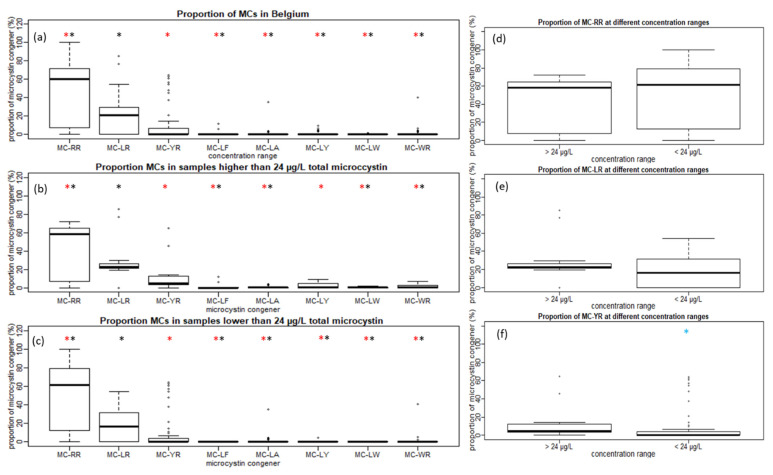
Figure 1.
(a) The distribution of the proportion of microcystin congeners (MCs) calculated at an individual sample level for all Belgian samples. (b) Samples with concentrations higher than 24 µg L−1 total microcystin. (c) Samples with concentrations lower than 24 µg L−1 total microcystin. (d) Proportions of MC-RR are compared in samples below and above the World Health Organization (WHO) guideline value. (e) Proportions of MC-LR are compared in samples below and above the WHO guideline value. (f) Proportions of MC-YR are compared in samples below and above the WHO guideline value. * Proportion of MC is significantly different from MC-LR at α < 0.05 using the Wilcoxon test. * Proportion of MC is significantly different from MC-YR at α < 0.05 using the Wilcoxon test. * Proportion of MC is significantly different from the proportion of MC at concentration range > 24 µg L−1 total microcystin with α < 0.05 using the Wilcoxon test.

