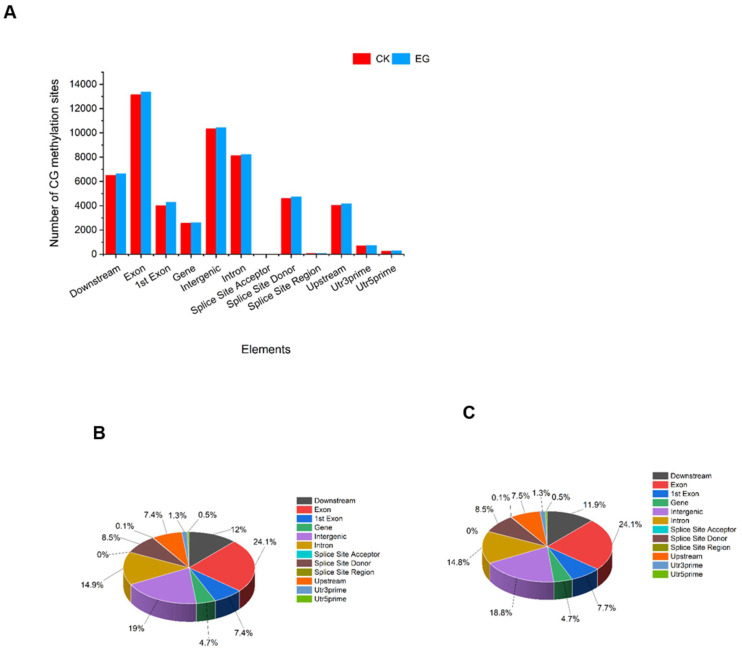
Figure 3.
Distribution of methylation sites in different gene functional elements. (A) The distribution of mCG in elements count. (B) The proportion of the mCG distribution in the CK samples. (C) The proportion of the mCG distribution in the EG samples. CK is the control sample, and EG is the drought-stress sample.

