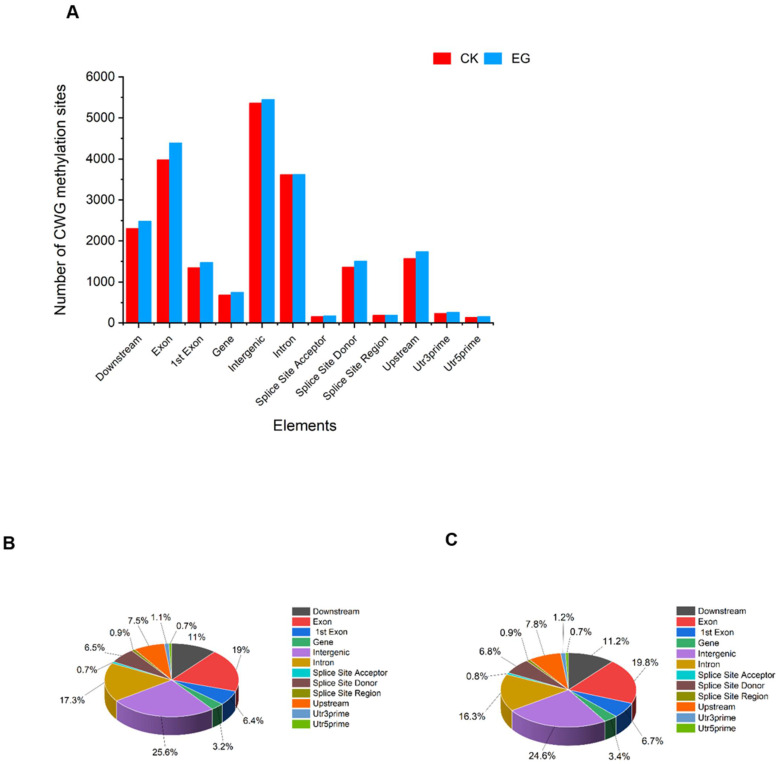
Figure 4.
Distribution of methylation sites in different gene functional elements. (A) The distribution of mCWG in elements count. (B) The proportion of the mCWG (W = A or T) distribution in the CK samples. (C) The proportion of the mCWG distribution in the EG samples. CK is the control sample, and EG is the drought-stress sample.

