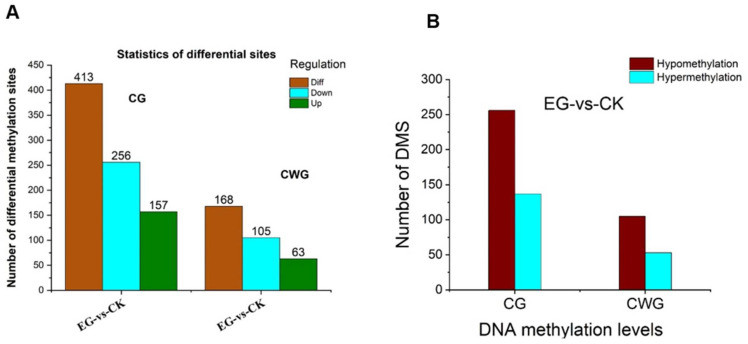
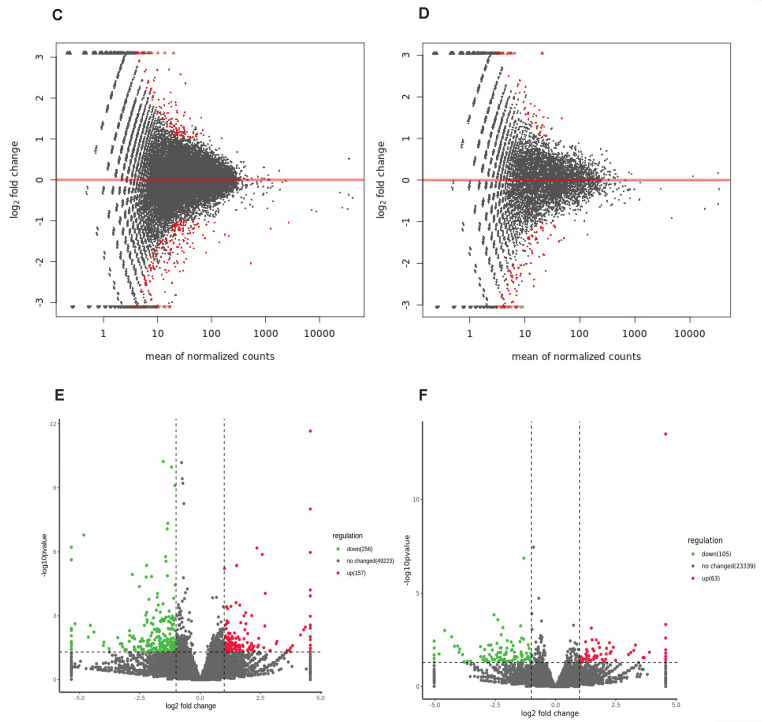
Figure 6.
Differential methylation in CG and CWG sites between EG-vs.-CK. (A) The number of differentially methylated CG and CWG sites. (B) the number of hypo/hypermethylated CG and CWG sites. (C,D) MA plot of DMS in CG and CWG sites. (E,F) Volcano plot of the DMS in CG and CWG sites. The small red circle represents upregulated DMS. The blue and dark grey color means the downregulated DMS and non-significant methylated sites.


