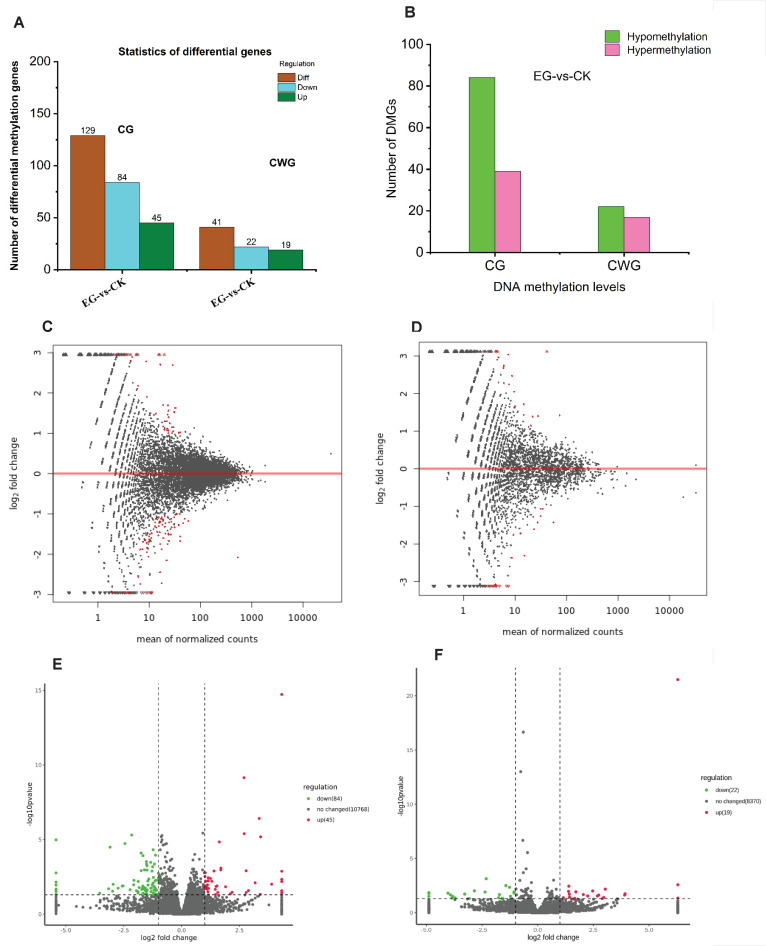
Figure 7.
Differential methylation gene at CG and CWG level between EG-vs.-CK. (A) The number of differential methylated genes in CG and CWG sites; (B) the number of hypo/hypermethylated genes in the CG and CWG sites; (C,D) MA plot of DMGs in CG and CWG sites; (E,F) volcano plot of the DMGs in CG and CWG sites. The small red circle represents upregulated DMS. The blue and dark grey color means the downregulated DMS and non-significant methylated sites.

