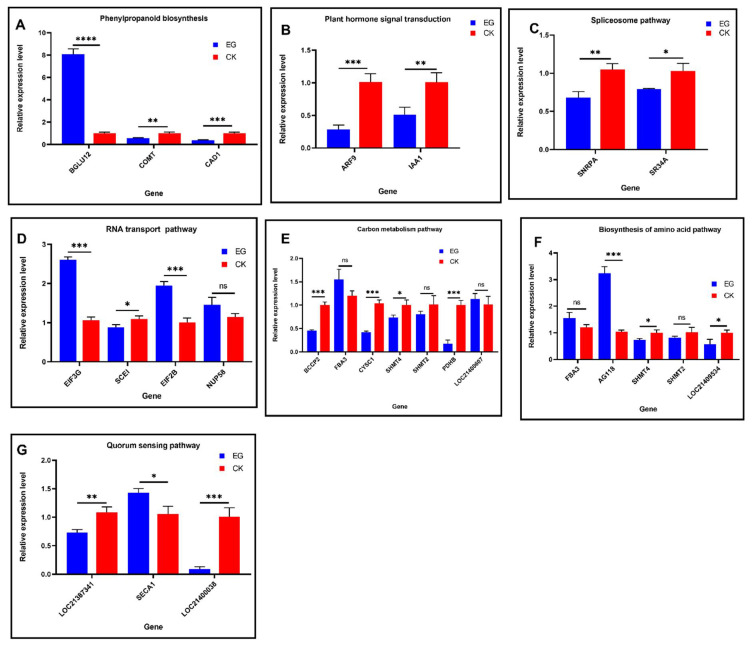
Figure 12.
qRT-PCR results of DMGs and DEGs in the KEGG enrichment pathways. From (A–G), represent the various KEGG pathways. Mulberry actin3 gene was used as the internal control gene. The mean value ± SD was used to analyze the relative transcript level of each gene by the 2−ΔΔCt method. The qRT-PCR reactions were run with three biological replicates in three technical replicates. Statistical analysis was performed using unpaired Student’s t-test by GraphPad Prism9 version 9.0.0 for Windows, GraphPad Software, San Diego, CA, USA. A p < 0.05 was considered significant. * p < 0.05, ** p < 0.01, *** p < 0.002, **** p < 0.0002, ns = not significant.

