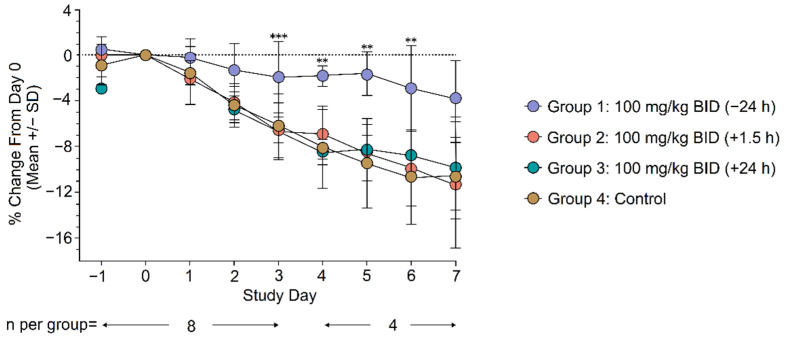
Figure 2.
Mean weight change from Day 0 through Day 7. Statistical analysis was conducted using an ANCOVA model with terms for treatment and baseline value as covariates. ** p < 0.01, *** p < 0.001 for difference in adjusted least-square means compared with the control. SD, standard deviation; BID, twice daily dosing.

