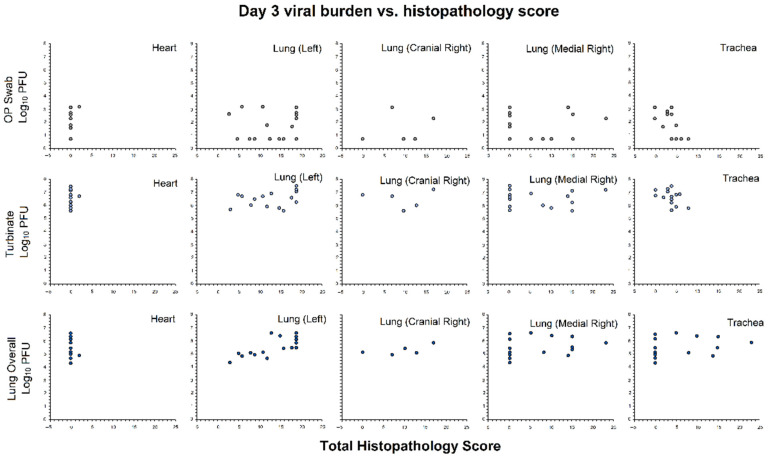
Figure 6.
Correlation analysis. Pearson’s correlation was used to measure the association of viral burden and histopathology total scores at each location for hamsters with both histopathology data and matching viral burden data at Day 3 (n = 16). Viral burden data were collected from OP swabs, lungs (combined cranial and caudal), and turbinates. Grey, OP swabs; Light blue, turbinates; Dark blue, lungs.

