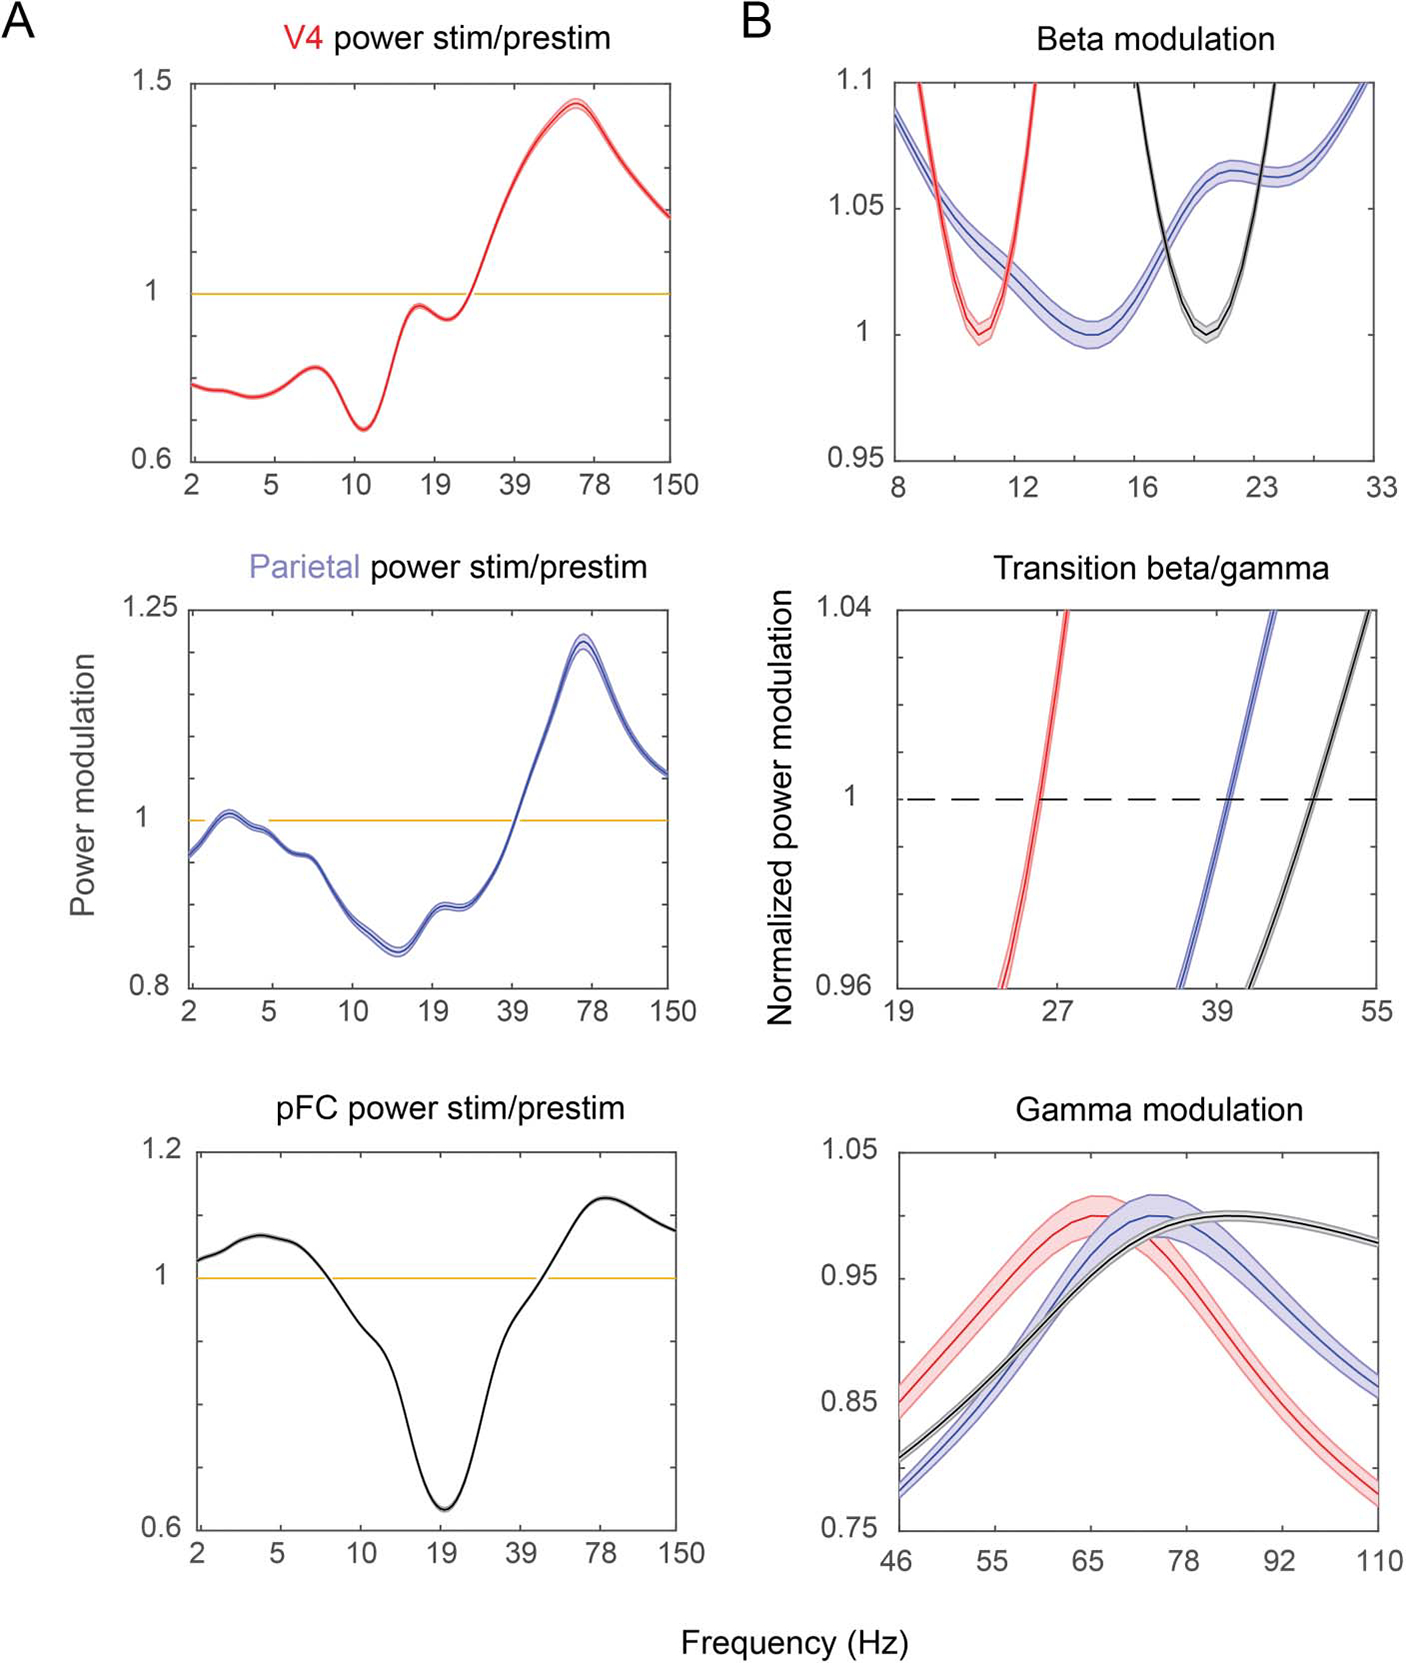
Figure 2.

Stimulus-induced power. A shows stimulus-induced power (stimulus [stim]/prestimulus [prestim] power; see Methods) for V4 (top, red), LIP (center, blue), and PFC (bottom, black). (B) Zoom in on the beta suppression (top) and transition from beta to gamma (center) and gamma peaks (bottom) for V4 (red), LIP (blue), and PFC (black). Note that the peaks and beta troughs are normalized to 1 for easier comparison between areas in the plots in B. Shaded areas show SEM.
