Figure 6.

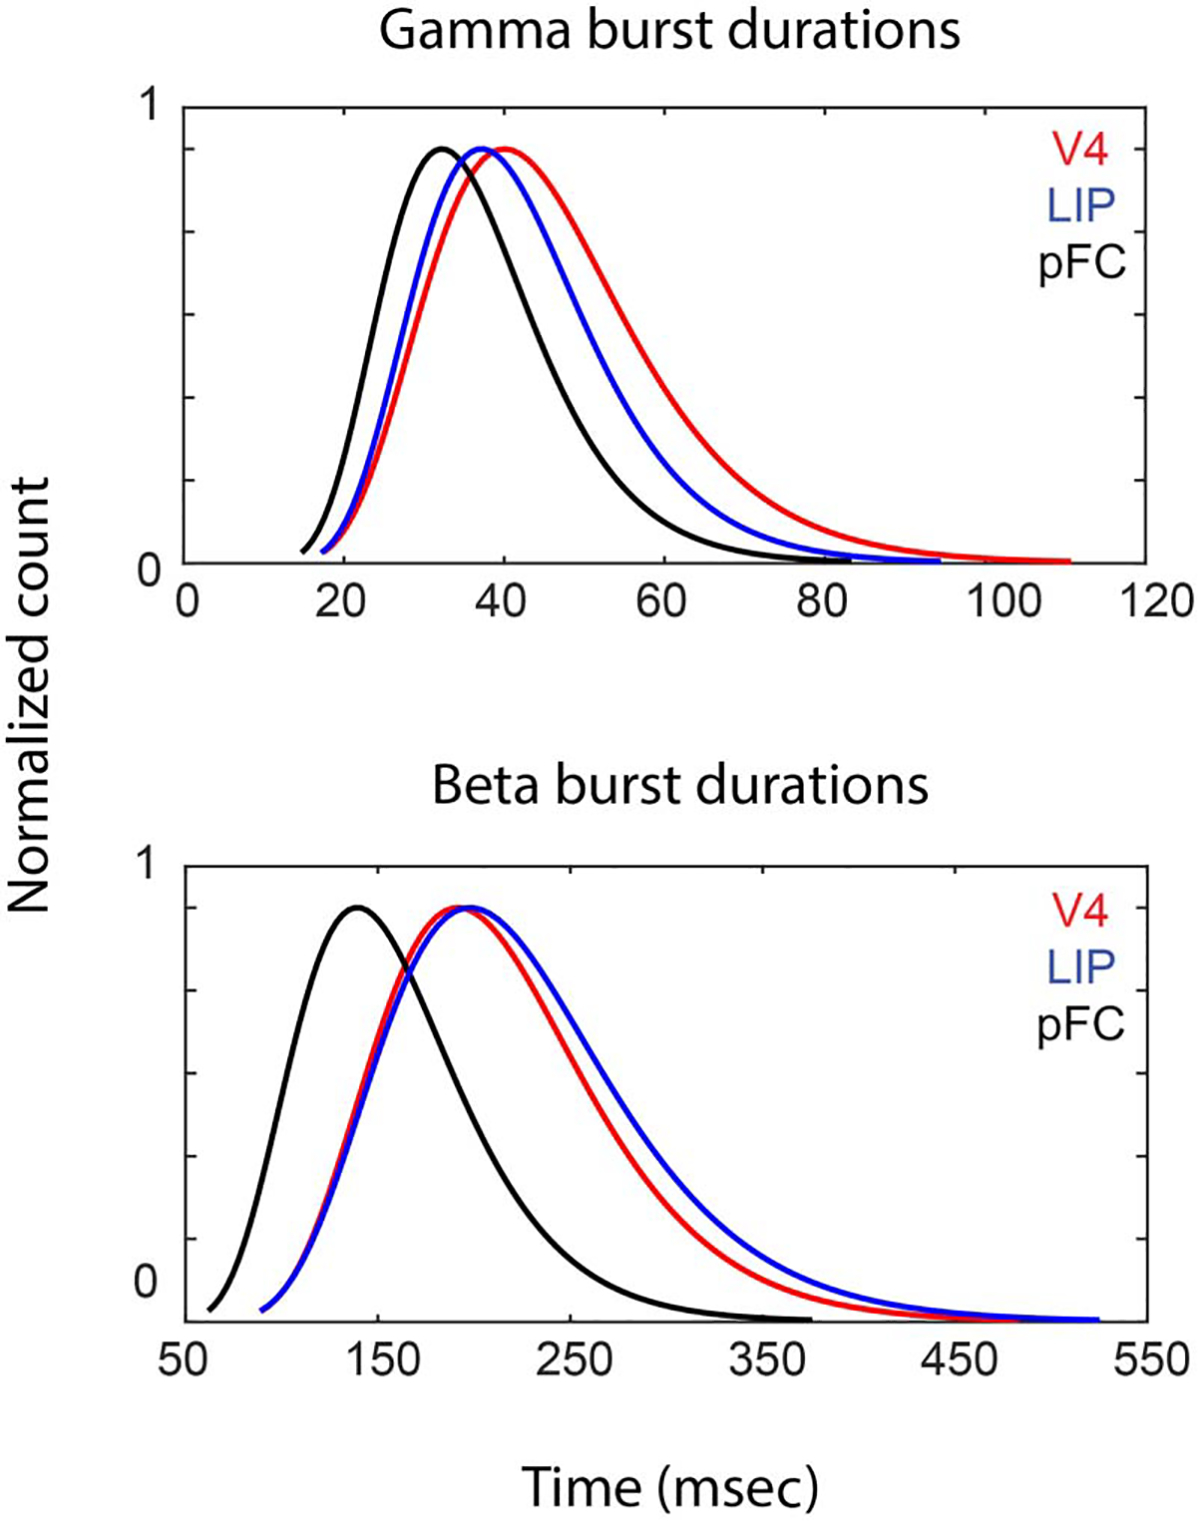
Burst durations per area. Plots show the log-normal fits to the distribution of burst durations for gamma (A) and beta (B), for V4 (red), LIP (blue), and PFC (black). Curves are normalized with respect to maximal count.

Burst durations per area. Plots show the log-normal fits to the distribution of burst durations for gamma (A) and beta (B), for V4 (red), LIP (blue), and PFC (black). Curves are normalized with respect to maximal count.