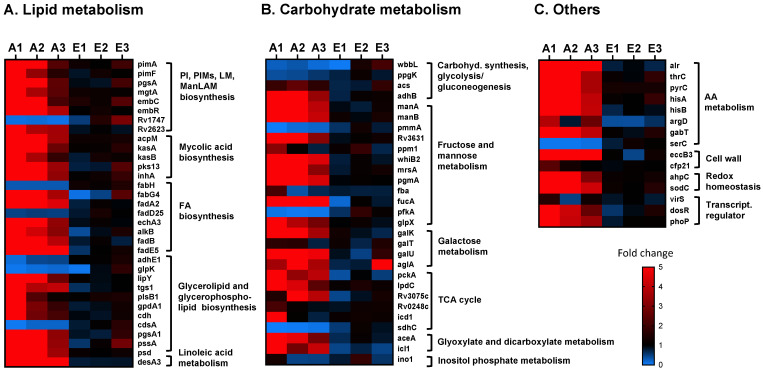
Figure 3.
Relative expression of cell envelope biogenesis and metabolism genes in M.tb Erdman exposed to A-ALF and E-ALF. Heatmap showing relative expression of cell wall genes associated with (A) lipid metabolism; (B) carbohydrate metabolism; and (C) other pathways in M.tb after being exposed to individual A-ALFs (n = 3 biological replicates, A1- to A3-ALFs), or to E-ALFs (n = 3 biological replicates, E1- to E3-ALFs). Expression was normalized using rpoB as reference gene and calculated using the 2−ΔΔCT method (ALF-exposed M.tb vs. heat-inactivated ALF-exposed M.tb). Heatmap was constructed using Prism v9, with downregulated genes in blue (0-to-1-fold changes) and upregulated genes in red (1-to-5-or-more-fold changes). Genes are grouped based on their assigned pathways (see Supplementary Table S1). Note that genes pimB, accD3, adhC (lipid metabolism), pmmB, Rv0794c (carbohydrate metabolism), and metZ (others) were below the limit of detection in one or more of the samples, and have not been included in the heatmaps.

