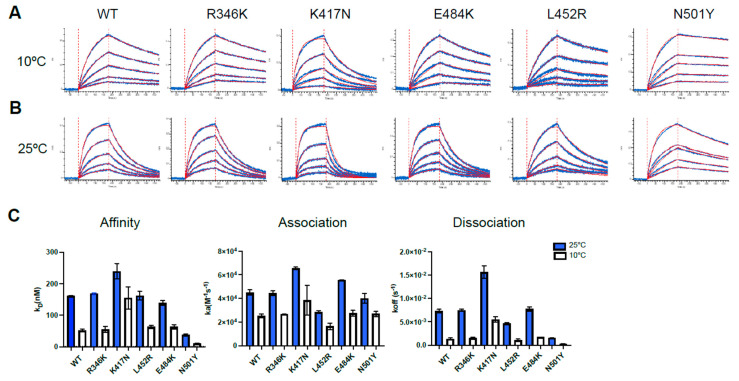
Figure 2.
Analysis of hACE2-RBD binding affinity by Biolayer Interferometry. (A–C) Binding kinetics between SARS-CoV-2 RBD (WT or different single mutant) assessed by BLI at two different temperatures. Biosensors coated with RBD proteins were incubated in two-fold dilution series of sACE2 (500 nM–31.25 nM) at 10 °C (A) and 25 °C (B) temperatures. Representative raw data are shown in blue and fitting model is shown in red. Graphs represent the affinity constants (KD), on rates (Ka) and off rates (Kdis), (C) values obtained in two different experiments at two different temperatures and calculated using a 1:1 binding model. All BLI data are summarized in Table S1.

