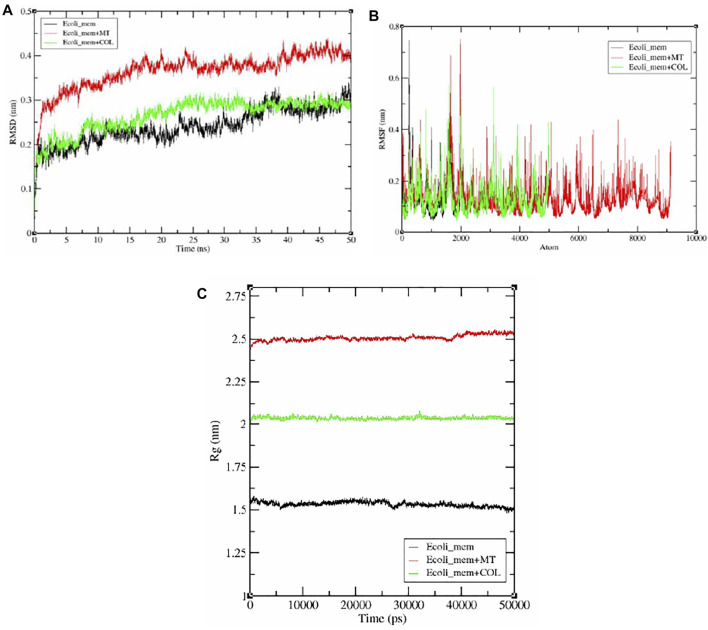
FIGURE 9.
Graphical representation (A) RMSD plot of E. coli_mem (black color), E. coli_mem + MT (red color), and E. coli_mem + COL (green color) and showing deviation and stability during 100-ns period. (B) RMSF plot with fluctuation per residues. (C) Radius of gyration (Rg) plot showing compactness of E. coli_mem, E. coli_mem + MT, and E. coli_mem + COL molecule during 50000ps simulation. Where nm, nanometer; ns, nanosecond; ps, picosecond.

