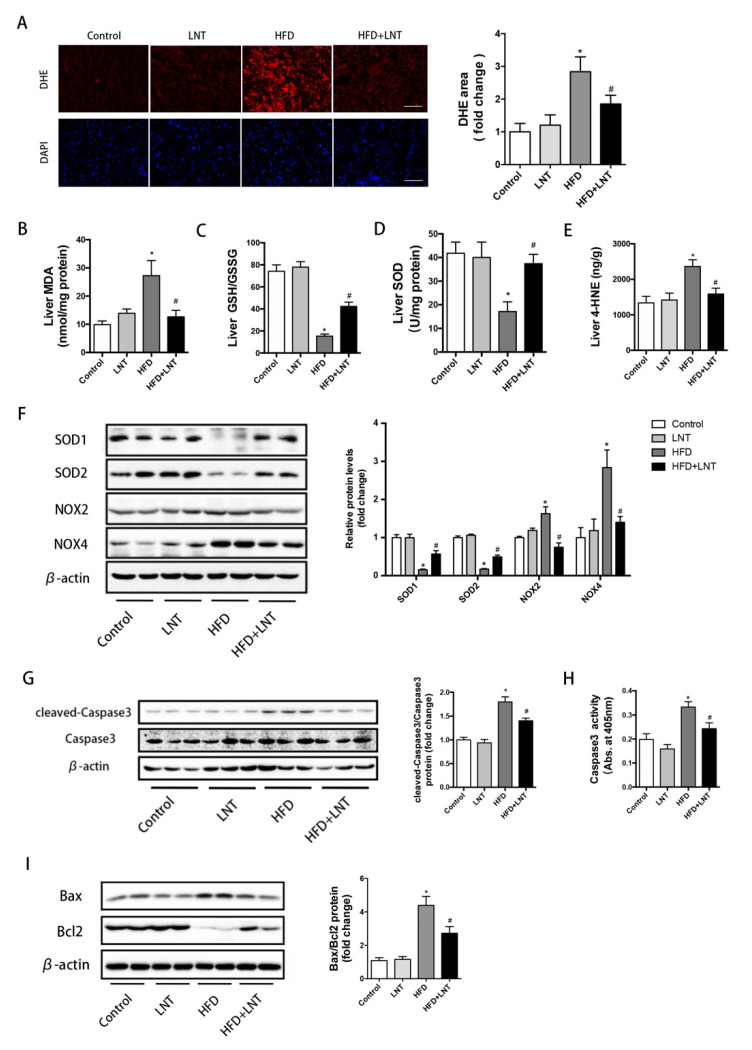
Figure 2.
LNT suppressed HFD-induced oxidative stress and apoptosis in the liver. (A) Representative images and quantification of DHE staining of hepatic ROS production. (B–E) MDA, GSH/GSSH, SOD, and 4-HNE levels in the liver. (F) Representative Western blots and quantification of SOD1, SOD2, NOX2, and NOX4 in the liver. (G) Cleaved-Caspase3 expression by Western blot analysis. (H) Caspase3 activity in livers from the four treatment groups. (I) Representative Western blots and quantification for apoptosis-related proteins in the liver. Data are presented as the mean ± SEM (n = 8 per group). * p < 0.05 compared with the Control group. # p < 0.05 compared with the HFD group.

