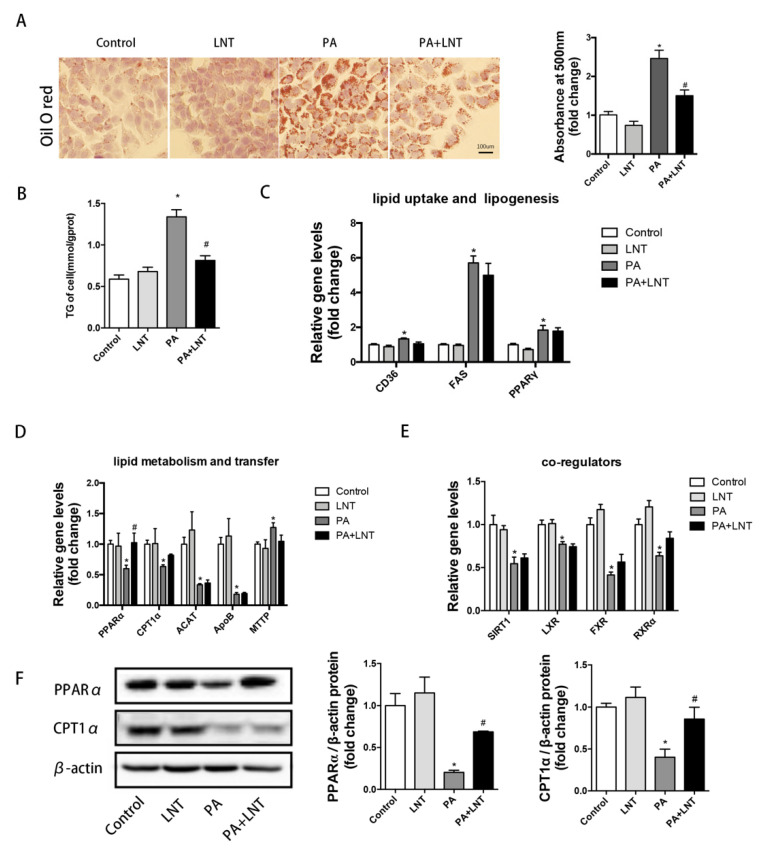
Figure 3.
LNT alleviated lipid accumulation in PA-induced AML12 cells. (A,B) Oil red O staining and TG content in AML-12 cells. (C–E) mRNA levels of lipid uptake-, lipogenesis-, metabolism-, and transfer-related genes in AML-12 cells. (F) Representative Western blots and quantification of PPARα and CPT1α in AML-12 cells. Data are presented as the mean ± SEM (n = 3 per group). * p < 0.05 compared with the Control group. # p < 0.05 compared with the PA group.

