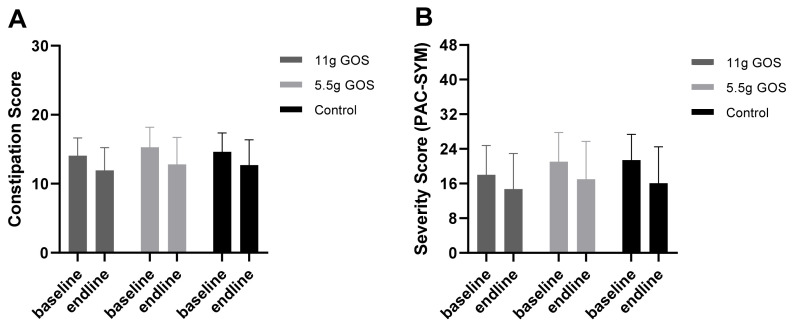
Figure 3.
(A) Constipation score (based on Agachan et al., 1997) (ranging from 0–30) and (B) symptom severity score (PAC-SYM) (ranging from 0–48) of ITT population at baseline and after the intervention period. The ANCOVA did not show any differences in Constipation Score between 11 g GOS and control (p = 0.529), nor between 5.5 g GOS and control (p = 0.717). The ANCOVA did not show any differences in PAC-SYM scores between 11 g GOS and control (p = 0.801), nor between 5.5 g GOS and control (p = 0.446).

