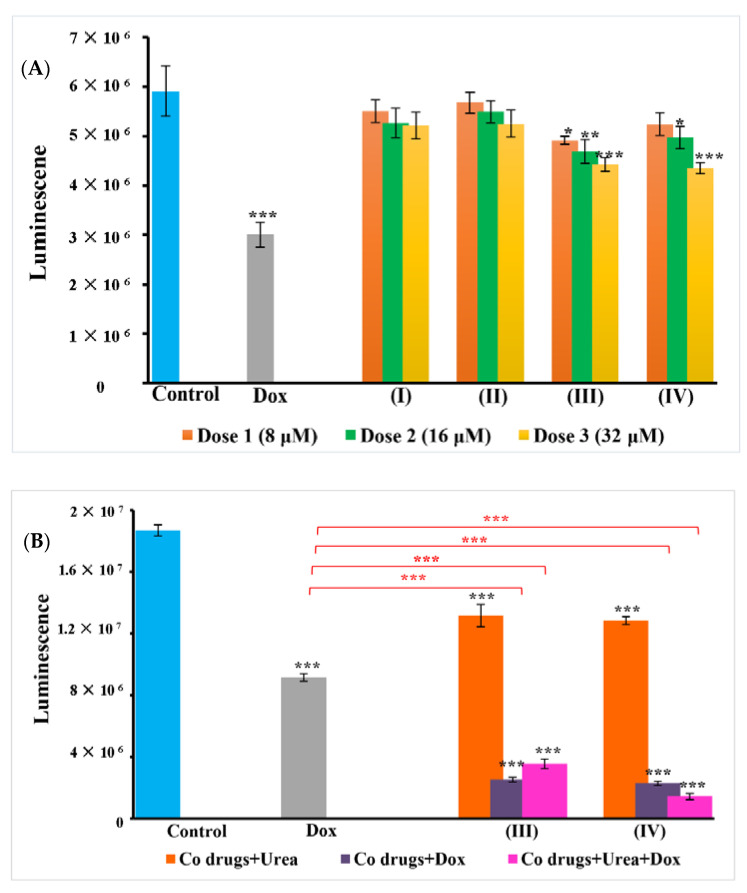
Figure 4.
ATP metabolism in A549 cells. (A) The cellular metabolism was accessed with the ATP levels in the control (untreated) and cells treated with different concentrations (8 μM, 16 μM, and 32 μM) of the cobalt complexes. (B) Standardized doses of complex (32 μM) combination with urea (2 mM) and doxorubicin (50 nM). The cytotoxic ability is evident in the figure with decreased levels of ATP in cobalt (III) complexes treated groups. As seen in the figure, complexes combination with urea and doxorubicin profound decrease in ATP. (A,B) clearly depict the difference in the action of cobalt complexes alone and in combination with doxorubicin and urea. Here, the cytotoxic activity and decrease in ATP levels of complexes (III and IV) treated groups signify their ability to boost the action of doxorubicin against A549 cells. The data represent the mean ± SEM. Results are significantly different at * p < 0.05, ** p < 0.01 and *** p < 0.001 when compared to control and doxorubicin.

