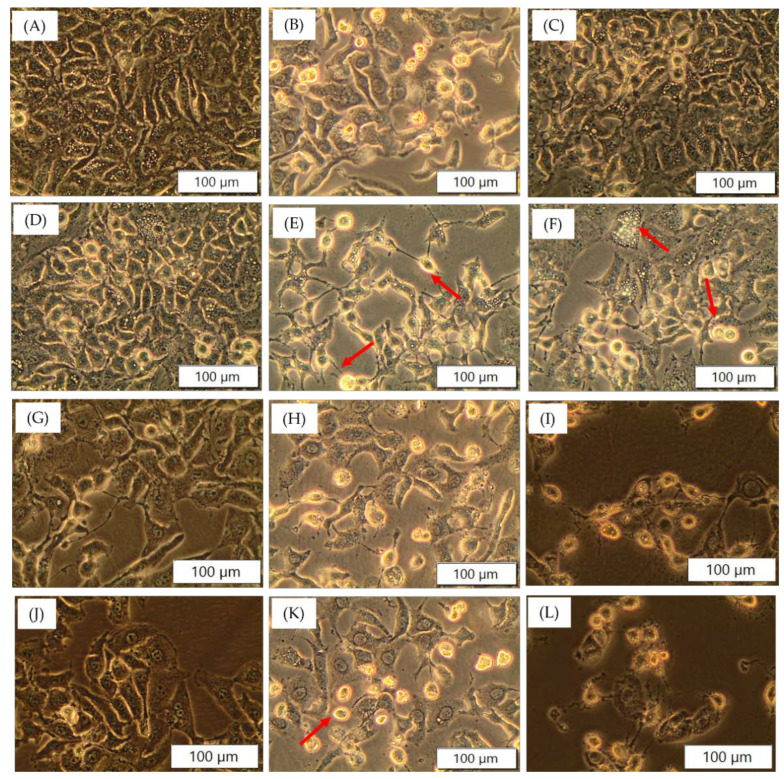
Figure 5.
Morphology of A549 treated with cobalt complexes, urea and doxorubicin. (A) Control (untreated); (B) Dox (50 nM); (C) 32 μM (I); (D) 32 μM (II) (E) 32 μM (III); (F) 32 μM (IV); (G) 32 μM (III) +2 mM urea; (H) 32 μM (III) + 50 nM Dox; (I) 32 μM (III) + 2 mM urea + 50 nM Dox; (J) 32 μM (IV) +2 mM urea; (K) 32 μM (IV) + 50 nM Dox; (L) 32 μM (IV) + 2 mM urea + 50 nM Dox. Intact cellular morphology is seen in the control group compared to treated groups. Clear and evident round cells detached from culture plate (indicated with arrows) can be seen in the image. Vacuole formation (arrow in (D)), shrinkage of cells, fewer cell population indicates low cell proliferation and increased cell death. These signs of cell death are more prominent in group (I,L) where the complexes in presence of urea might have facilitated cytotoxic action of doxorubicin.

