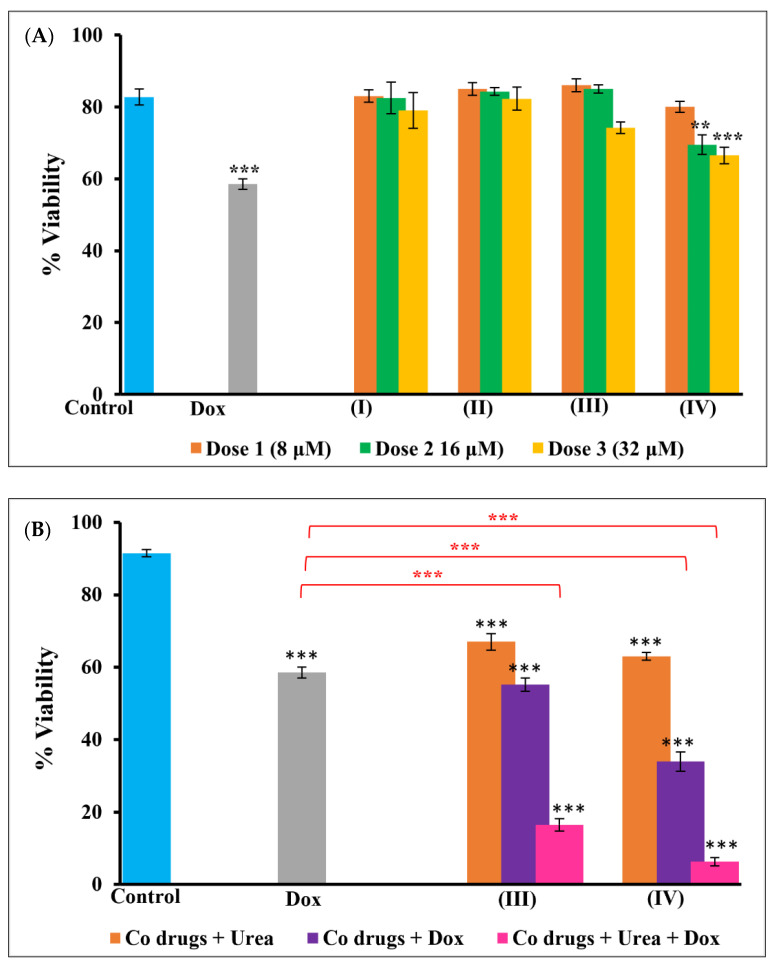
Figure 6.
Trypan blue viability test in A549 cells. Graph (A) shows the viability of A549 cells treated with complex alone and in combination with doxorubicin. Graph (B) shows the commendable increase in the ability of doxorubicin in inducing cell death when combined with urea. As seen in other assays, cobalt III and IV complexes induced better toxicity in A549 cells compared to other complexes as seen in (A). Moreover, urea and doxorubicin induced more cell death whereby these cells stained well with trypan blue. Significance in these groups can be seen increased by several folds. Results are significantly different at ** p < 0.01 and *** p < 0.001 when compared to control and doxorubicin.

