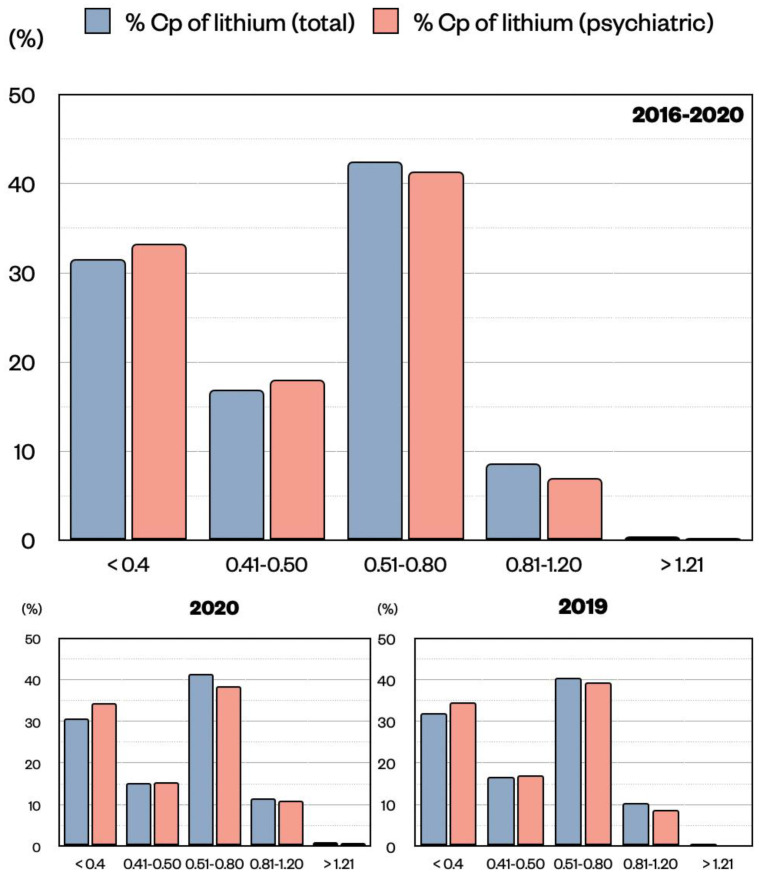
Figure 2.
Distribution of lithium Cp (mmol/L) expressed as percentage of the total population (pink) or of the psychiatric unit only (blue) divided by ranges (<0.4, 0.41–0.50, 0.51–0.80, 0.81–1.20, >1.20). Data are shown for all five years 2016–2020, and for the single years 2020 and 2019, respectively. No significant difference was observed in the distribution of Cp samples in the two populations by means of z-test.

