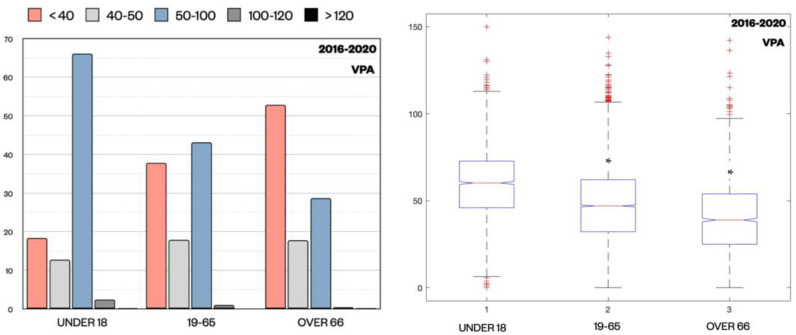
Figure 5.
Distribution of VPA Cp (μg/mL) expressed as percentage for each subpopulation divided by ranges (<40, 40–50, 50–100, 100–120, >120) and by age groups (under 18, 19–65, over 66). z-test revealed a statistically significant difference in Cp distribution proportions across the age groups, in particular for samples < 40 μg/mL and between 50 μg/mL and 100 μg/mL. The median value of VPA (μg/mL) for each age group is also shown. * p < 0.001 compared to the group under 18 by Kruskal–Wallis test. (+ outliers samples are marked).

