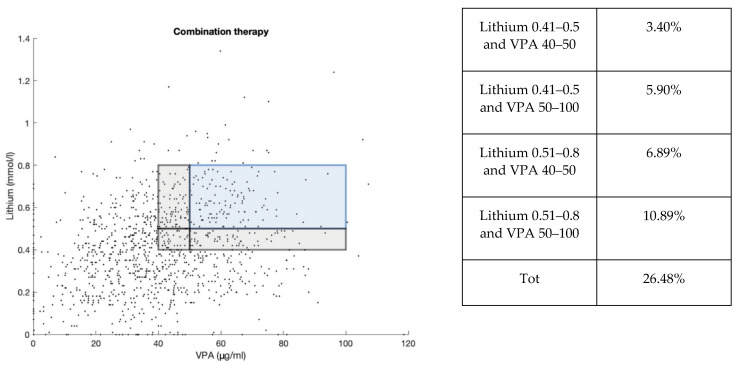
Figure 8.
Scatter plot representing the distribution of lithium Cp (mmol/L) and VPA Cp (μg/mL) samples in combination therapy (1118). Samples in the therapeutic range of lithium (0.5–0.8 mmol/L) and VPA (50–100 μg/mL) are highlighted in the blue area. An additional gray area shows values of lithium (0.4–0.5 mmol/L) and VPA (40–50 μg/mL) close to the therapeutic range. These percentage values are reported in the table.

