Fig. 11.

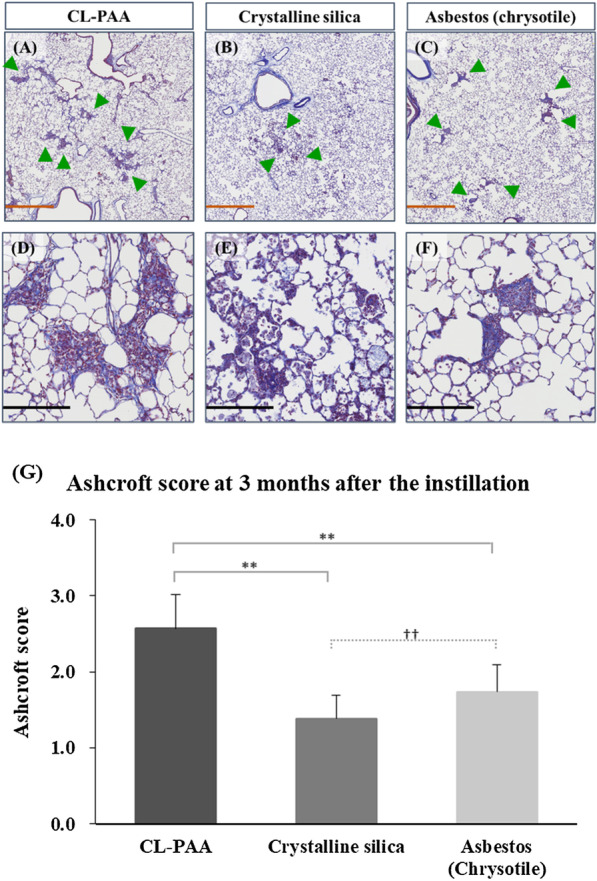
Histological findings and the Ashcroft score at 3 months following the instillation. A, D 1.0 mg CL-PAA-exposed lung, B, E 1.0 mg crystalline silica-exposed lung, C, F 1.0 mg asbestos (chrysotile)-exposed lung. A–C are low magnification images of D–F, respectively. Although pulmonary fibrosis (green arrow heads) was observed around the bronchiole region in all groups, it was more prominent in the CL-PAA group compared to the crystalline silica and asbestos (chrysotile) group (internal scale bar = 2.5 mm for brown, 250 μm for black) The Ashcroft score at 3 months after the instillation G showed that CL-PAA induced more severe pulmonary fibrosis than crystalline silica and asbestos (chrysotile). The Ashcroft score of each control group was all zero. Data are presented as mean ± SE (**p < 0.01 and ††p < 0.01,*indicates that there is a significant difference in the scores between the two groups, respectively.)
