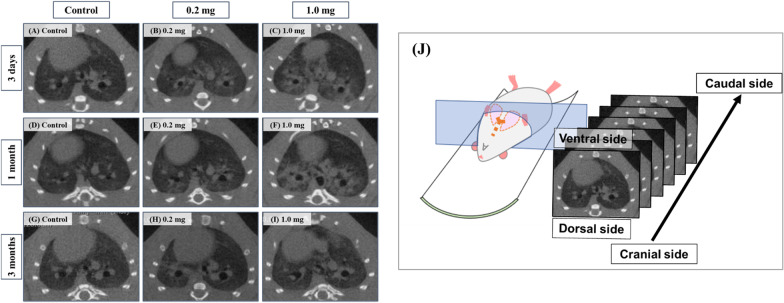
Fig. 7.
3D micro-CT imaging following intratracheal instillation and how to view the CT image and the relationship between the CT image and the anatomical position. At 3 days: A control group. B 0.2 mg-exposure group. C 1.0 mg-exposure group. At 1 month: D control group. E 0.2 mg-exposure group. F 1.0 mg-exposure group. At 3 monthss: G control group. H 0.2 mg-exposure group. I 1.0 mg-exposure group. Diffuse or centrilobular infiltration (red arrow) in both lungs was presented at 3 days and 1 month after the exposure in a dose-dependent manner. The finding was persisted during 1 month and improved at 3 months after the exposure. The relationship between the CT image and the anatomical position is shown at J

