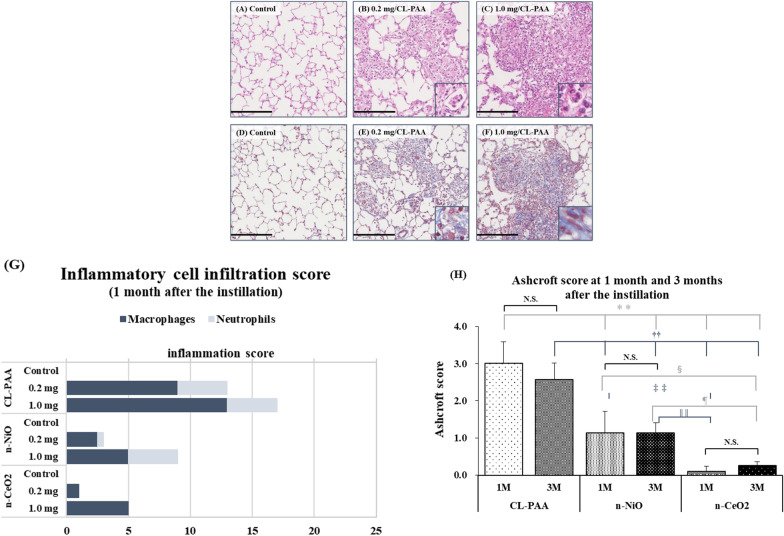
Fig. 9.
Histological findings at 1 month following the instillation and the evaluation of lung lesions. A–C and D–F show HE staining and MT staining images, respectively, at 1 month after the instillation of 0.2 mg or 1.0 mg-CL-PAA. Red and black arrow heads, and black arrows indicate neutrophils and macrophages, and collagen deposition, in the alveolar space or alveolar septa, respectively. Histological findings of NiO nanoparticles and CeO2 nanoparticles were shown in our previous report [16, 17]. G shows the inflammatory cell infiltration score in the 0.2 mg or 1.0 mg CL-PAA, NiO nanoparticles, or CeO2 nanoparticles-exposed lungs at 1 month after the instillation. The inflammatory cell infiltration was observed in dose dependent manner, and more prominent compared to the NiO nanoparticles or CeO2 nanoparticle. H shows the Ashcroft score in the 1.0 mg CL-PAA, NiO nanoparticles and CeO2 nanoparticles-exposed lungs at 1 month and 3 months after the instillation. Although pulmonary fibrosis induced was persisted in each exposed group during 1 month to 3 months after the instillation, it was more severe by CL-PAA than by NiO nanoparticles and CeO2 nanoparticles. The Ashcroft score of each control group was all zero. Data are presented as mean ± SE (**p < 0.01, ††p < 0.01, §p < 0.05, ‡‡p < 0.01, ¶p < 0.05, ||||p < 0.01, *indicates that there is a significant difference in scores between the two groups. N.S. means no significance.) n-NiO and n-CeO2 indicate that NiO nanoparticles and CeO2 nanoparticles, respectively. One-way analysis of variance (ANOVA) followed by Turkey's test was used to appropriately to detect individual difference among the exposed groups

