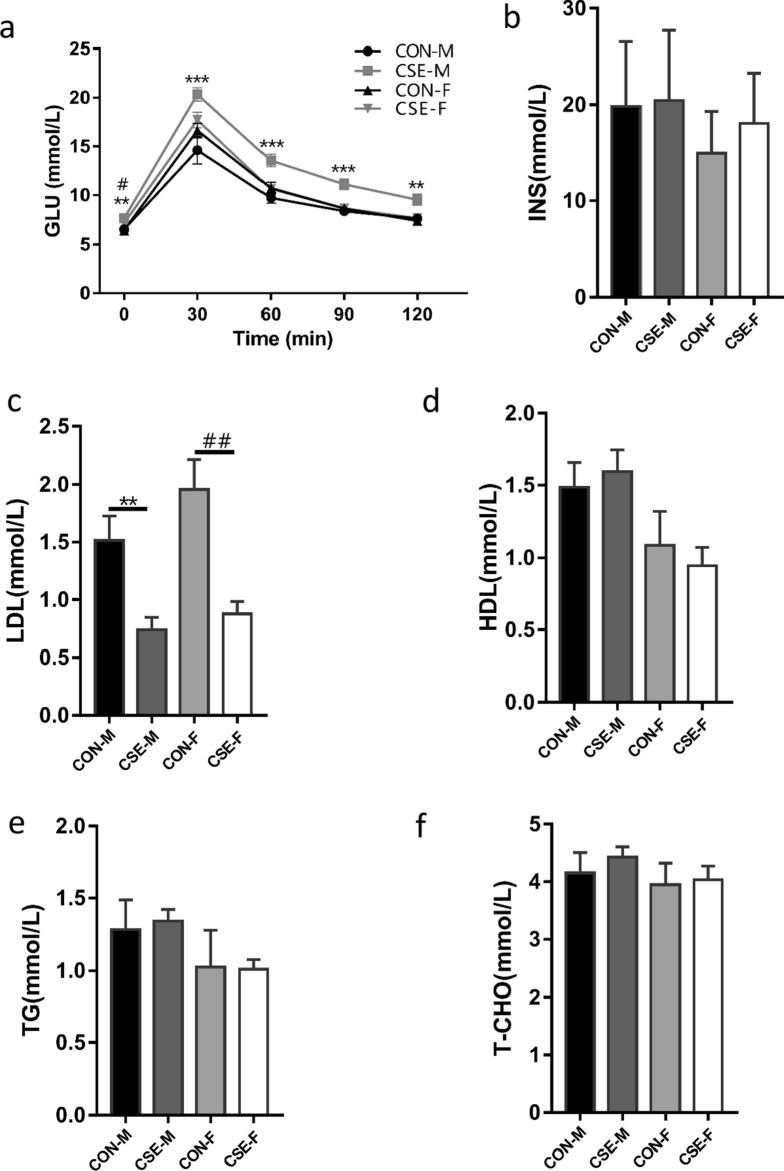
Fig. 3.
Metabolic alterations in 10-week-old offspring in different groups. a Blood glucose curves in offspring evaluated by intra-peritoneal glucose tolerance test (IPGTT) and b insulin (INS) in offspring of different groups. Serum levels of low-density lipoprotein (LDL, c), high-density lipoprotein (HDL, d), triglyceride (TG, e), and total cholesterol (T-CHO, f) in offspring of different groups. CON-M and CON-F male and female offspring in the CSE group; CSE-M and CSE-F male and female offspring in the CON group. #p < 0.05, between CON-F and CSE-F groups; ##p < 0.01, between CON-F and CSE-F groups; **p < 0.01, between CON-M and CSE-M groups; ***p < 0.001, between CON-M and CSE-M groups

