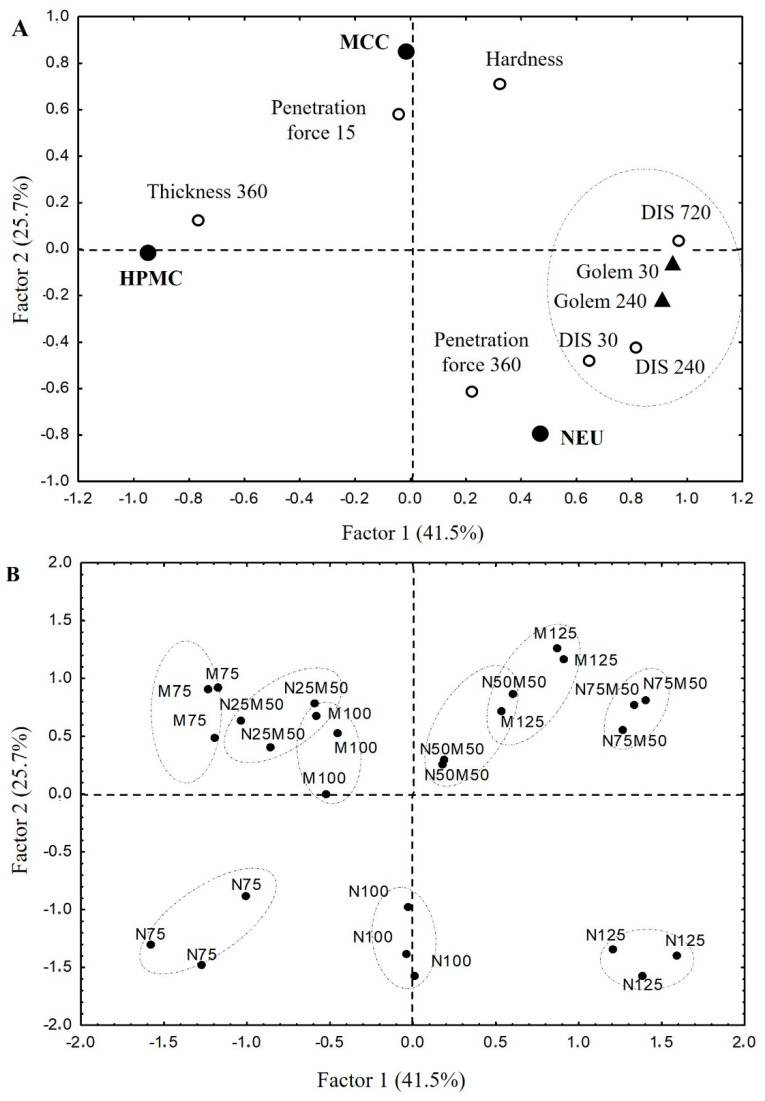
Figure 8.
PCA loadings and scores plot: (A) PCA loadings plot; model depicts following variables: tablet hardness; drug amount released in 30 min = burst effect; drug amount released in 240 and 720 min; the gel layer thickness after 360 min swelling; penetration force in 15 and 360 min; (B) PCA scores plot; model shows a layout of the evaluated samples.

