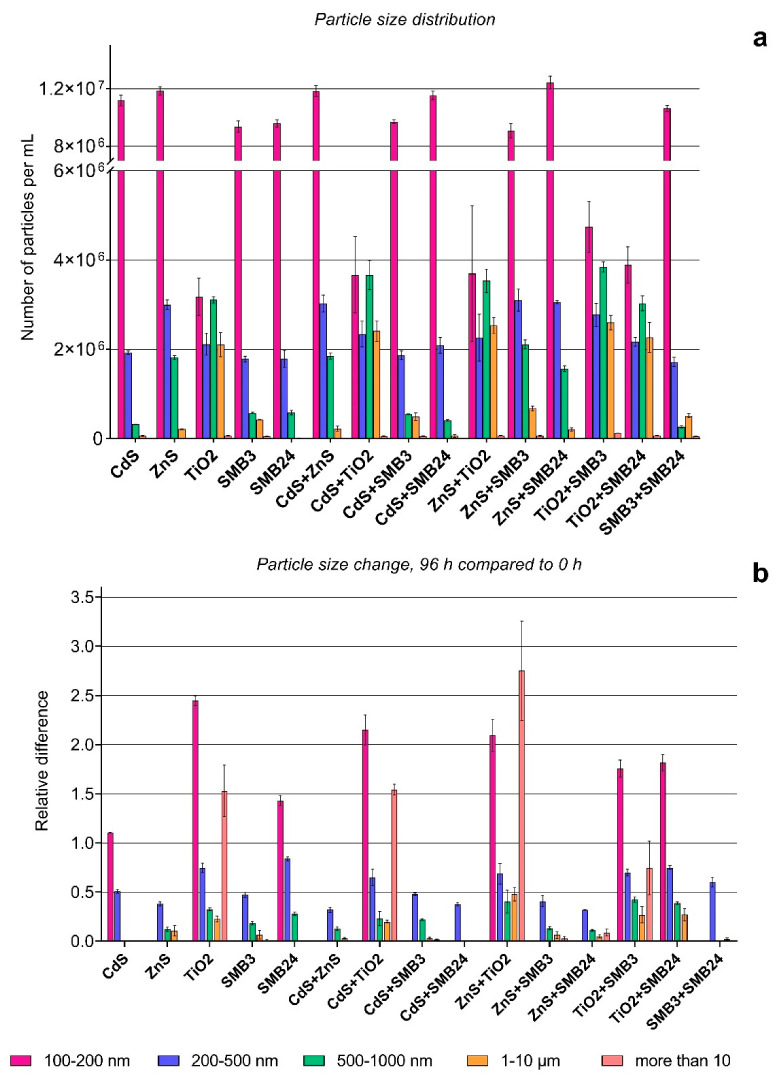
Figure 4.
Particle size distribution and size change with time. (a) Size distribution of NPs after dispersion. (b) Relative particle size change after 96 h compared with 0 h. The values higher than 1.0 mean surpassing the experimental group compared with the reference group, and the values below 1.0 mean a corresponding reduction in the experimental group compared with the reference group (the lower value, the higher the reduction). Statistically insignificant results (p > 0.05) are not represented on the graph.

