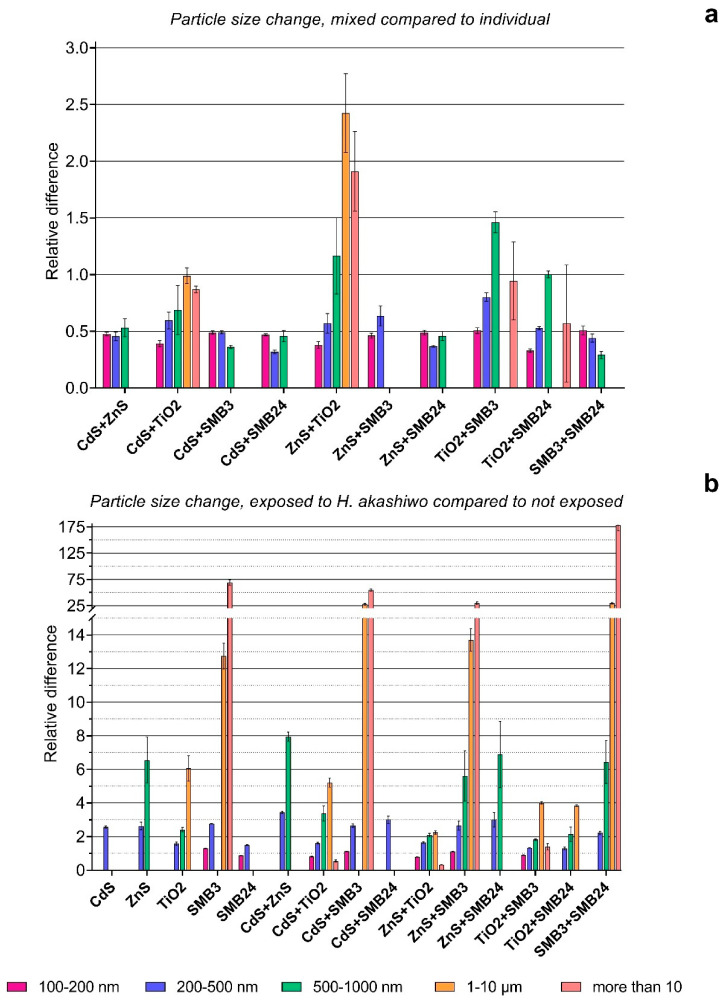
Figure 5.
Effects of binary mixtures and presence of H. akashiwo on the size of the NPs. (a) Relative particle size change in binary mixtures compared with the sum of individual NPs after 96 h. (b) Relative particle size change after 96 h of exposure with H. akashiwo compared with 96 h of exposure without H. akashiwo. The values higher than 1.0 mean surpassing the experimental group compared with the reference group, and the values below 1.0 mean the corresponding reduction of the experimental group compared with the reference group (the lower value, the higher the reduction). Statistically insignificant results (p > 0.05) are not represented on the graphs.

