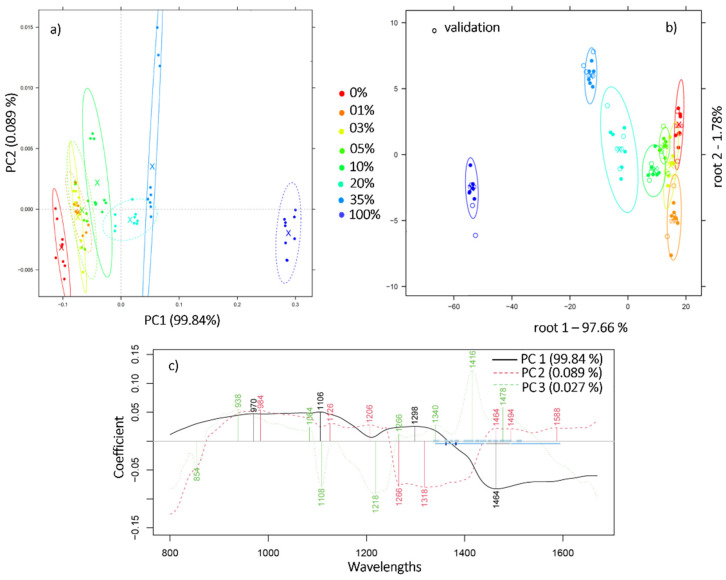
Figure 2.
(a) PCA scores plot reveals separation along PC1 axis of the mixtures containing Robusta concentration in the range 1%–35%, N = 72, wavelength range 800–1670 nm, Savitzky-Golay smoothing (window size 19) and MSC; (b) PCA-LDA classification plot of the robusta adulterated ground coffee in the concentration range 1%–35%, wavelength range 1300-1600 nm, N = 72; (c) PCA loadings plot.

