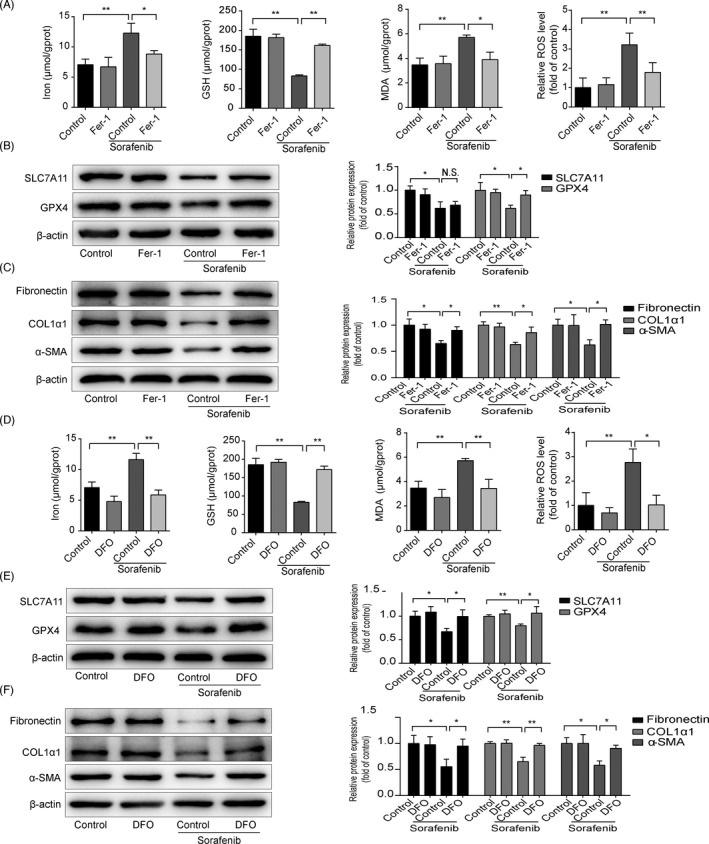
FIGURE 4.

Blockade of HSC ferroptosis abolishes sorafenib‐induced anti‐fibrotic effect. HSC‐T6 cells were exposed to Fer‐1(1 μM), DFO (100 μM) or/and sorafenib (10 μM) for 24 h. (A) and (D) Iron, MDA and GSH contents in cell lysates were measured by kits. Intracellular ROS generation was detected with DCFH‐DA probe. Data were presented as the mean ± SD of 3 independent experiments. *p < 0.05, **p < 0.01. (B) and (E) Western blot analyses of SLC7A11 and GPX4 proteins were performed. Data were presented as the mean ± SD of 3 independent experiments. *p < 0.05, **p < 0.01. N.S. not significant. (C) and (F) Western blot analyses of α‐SMA, COL1α1 and fibronectin proteins were performed. Data were presented as the mean ± SD of 3 independent experiments. *p < 0.05, **p < 0.01
