
FIGURE 4.
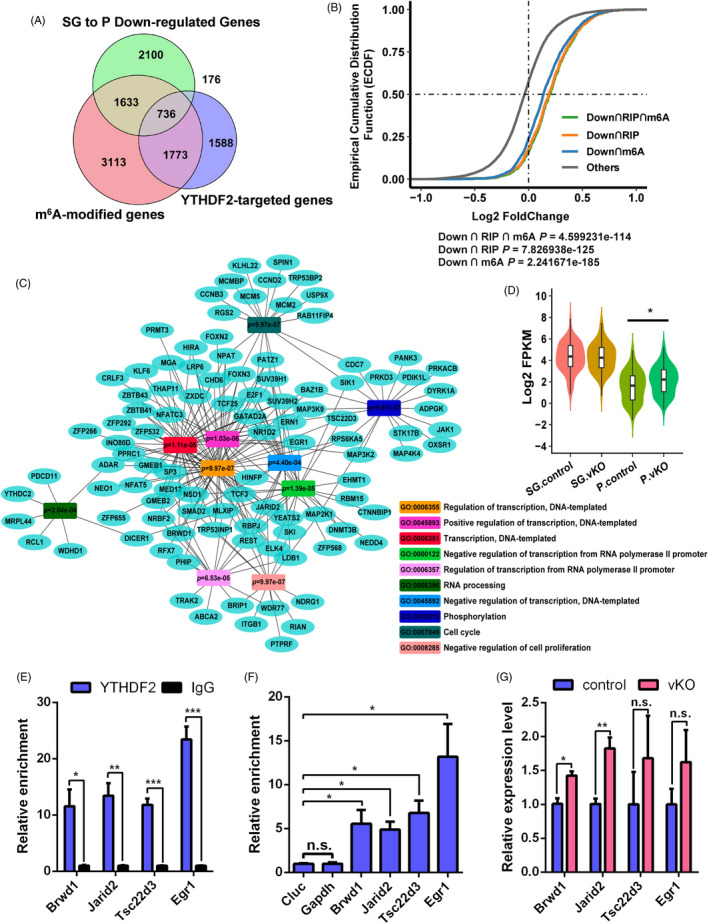
YTHDF2 promotes the degradation of its target mRNA. (A) Venn diagram showing that overlaps among genes down‐regulated from control differentiated spermatogonia to pachytene spermatocyte, m6A‐modified genes and YTHDF2‐targeted genes. The m6A‐seq data were acquired from a published data 18 . YTHDF2‐targeted genes were identified in adult whole testes. (B) Cumulative distributions of relative stability change between control and Ythdf2‐vKO pachytene spermatocytes. (C) GO analysis of genes with delayed degradation from differentiated spermatogonia to pachytene spermatocyte. (D) The RNA expression level of transcription‐associated genes at different stages of germ cells. Significance was calculated with two‐tailed Mann‐Whitney test (*p < 0.05). (E) YTHDF2‐targeted candidates verified by YTHDF2‐RIP‐qPCR in control and Ythdf2‐vKO testes. IgG was used as negative control. (F) m6A‐enriched candidates verified by m6A‐RIP‐qPCR in control and Ythdf2‐vKO testes. Non‐m6A‐modified gene Cluc was used as a negative control. (G) qPCR validation of delayed genes in control and Ythdf2‐vKO pachytene spermatocytes. Data of (E‐G) are presented as means ± SEM (n = 3 for each group). Significance was calculated with unpaired two‐tailed Student's t‐test (n.s., not significant, *p < 0.05, **p < 0.01, ***p < 0.001)