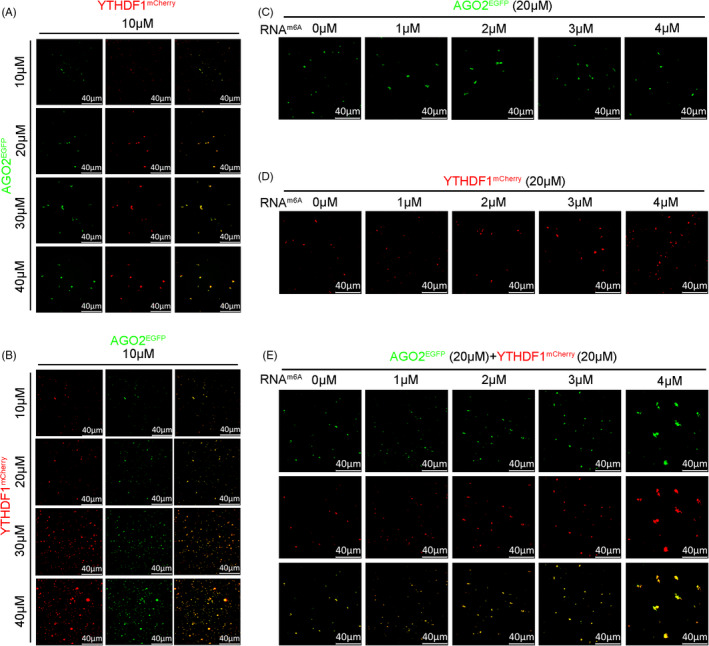
FIGURE 6.

YTHDF1 driving the phase separation of YTHDF1/AGO2 complex. (A) AGO2EGFP (10–40 μM) slightly increased the LLPS in the presence of YTHDF1mCherry (10 μM) in 150 mM NaCl. (B) YTHDF1mCherry (10–40 μM) increased the LLPS significantly in the presence of AGO2EGFP (10 μM) in 150 mM NaCl. (C) RNAm6a (1–4 μM) did not significantly increase the LLPS of AGO2EGFP (20 μM) in 150 mM NaCl. (D) RNAm6A (1–4 μM) increased the LLPS of YTHDF1mCherry (20 μM) significantly in 150 mM NaCl. (E) RNAm6A (1–4 μM) increased the LLPS of solutions containing AGO2EGFP (20 µM) and YTHDF1mCherry (20 µM) in 150 mM NaCl
