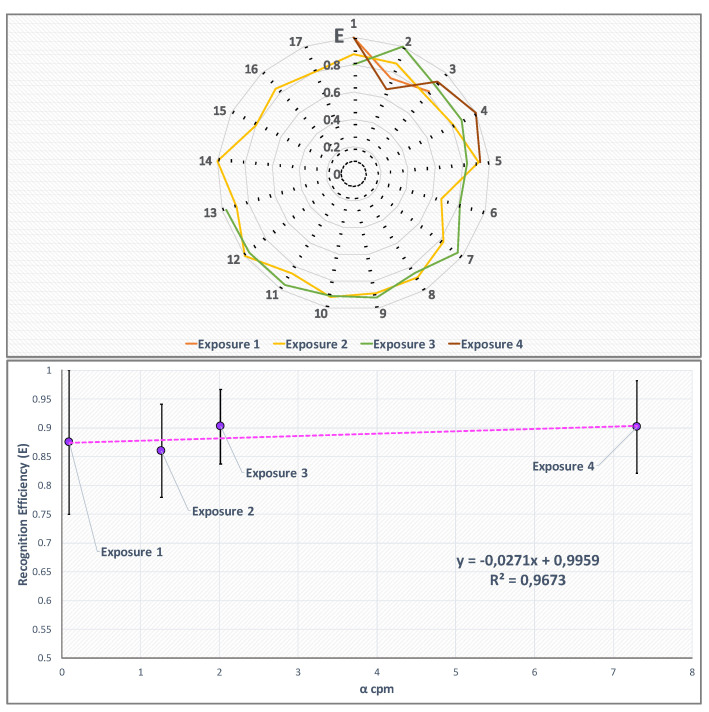
Figure 7.
Upper canvas: Recognition efficiency values evaluated according to Equation (4) for the single measurements (x-axis shows the number of measurement, y-axis the algorithm recognition efficiency E) performed at different radon activity concentration values (different line colors). Lower canvas: mean recognition efficiency value for each exposure versus the mean counts per minute detected by the TimePix.

