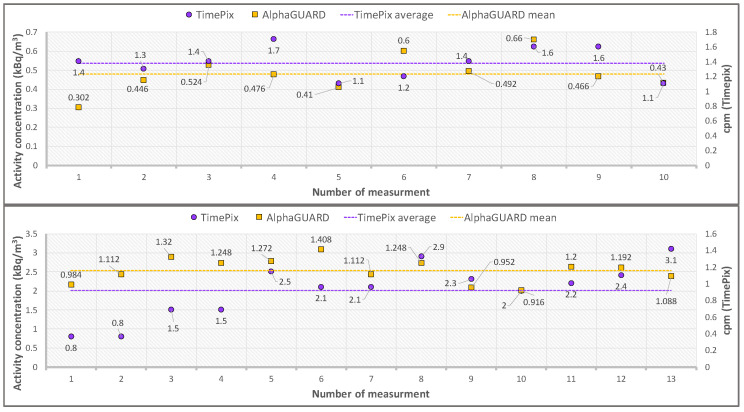
Figure 8.
Time series of data acquired by TimePix and the AlphaGUARD are shown for Exposure 2 and 3 (for the run characteristics, see Table 1). Upper canvas—Exposure 2: time series of the radon concentration activity (AlphaGUARD, yellow squares) and the α cpm values registered by the TimePix (purple circles). The mean radon activity concentration (dotted yellow line) results equal to 0.48 ± 0.05 kBq/m3 and the mean α cpm value (purple dotted line) is 1.26 ± 0.21. Lower canvas—Exposure 3: time series of the radon concentration activity (AlphaGUARD, yellow squares) and of the α cpm values registered by the TimePix (purple circles). The mean radon activity concentration (dotted yellow line) results equal to 1.16 ± 0.12 kBq/m3 and the mean α cpm value (purple dotted line) is 2.01 ± 0.48. The statistical errors are evaluated as the standard deviations of the time series.

