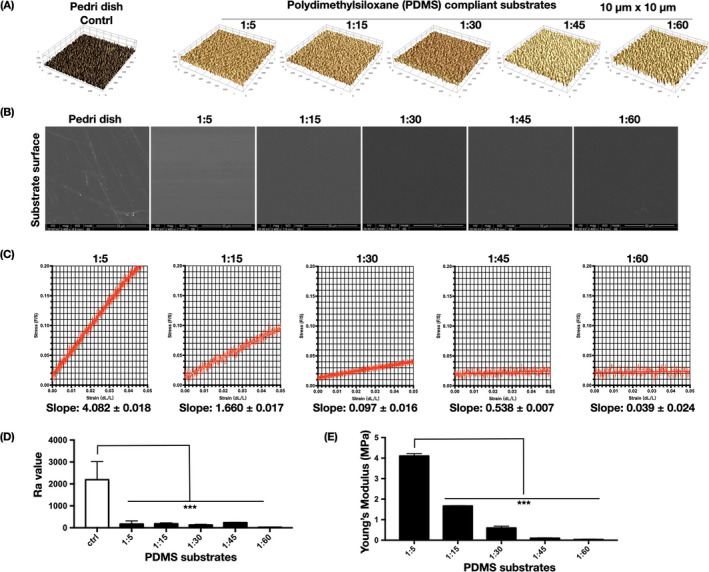
FIGURE 1.

Basic characteristics of the PDMS substrates. (A) Representative surface topography of PDMS modified by different mixing ratios, in an area of 10 × 10 μm (n = 3 images). (B) SEM images of the morphology of dopamine‐coated PDMS substrates of different mixing ratios (n = 3 images). (C) Representative stress–strain curves of different PDMS substrates obtained through tensile testing. The scatter points (n = 500) are derived from the linear elastic region. The slope value is calculated by linear regression of the scatter points, with a 95% confidence interval. (D) PDMS surface Ra parameter (n = 3 independent experiments). Significant difference compared with Petri dish. *p < .05, **p < .01, **p < .001. (E) Young's moduli of the PDMS substrates (n = 6 independent experiments). *Significant difference compared with 1:5 PDMS substrate. *p < .05, **p < .01, **p < .001
