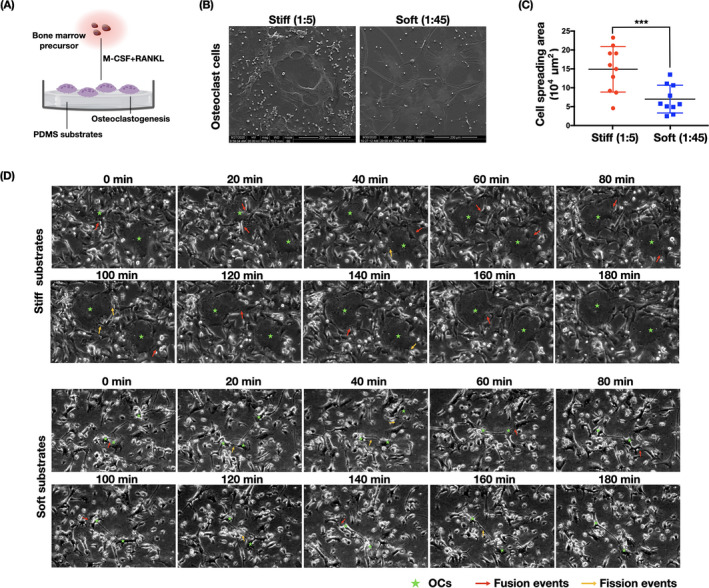
FIGURE 2.

Changes in osteoclast morphology and fusion/fission activities under stiffness stimulation. (A) Schematic diagram illustrating bone marrow precursor cells undergoing osteogenic differentiation on PDMS substrates. (B) Morphologies of osteoclasts regulated by PDMS substrates of different stiffness degress (n = 3 independent SEM experiments). (C) Quantification of cell spreading regions in (B) (n = 10 independent quantification). Data are the mean ±SD. ***p < .001. (D) Bone marrow precursor cells were cultured on PDMS substrates of different rigidity (culture media containing M‐CSF and RANKL) for 7 days. Thereafter, live cell imaging was recorded for 24 continuous hours. Osteoclast fusion and fission events were observed. The image is sectioned from the subsequent 24‐h recorded series (n = 5 biological replicates). Time intervals of the individual images are noted above each image. Fusion events are indicated in red arrows and fission events in yellow arrows, and osteoclasts are marked with a green star
