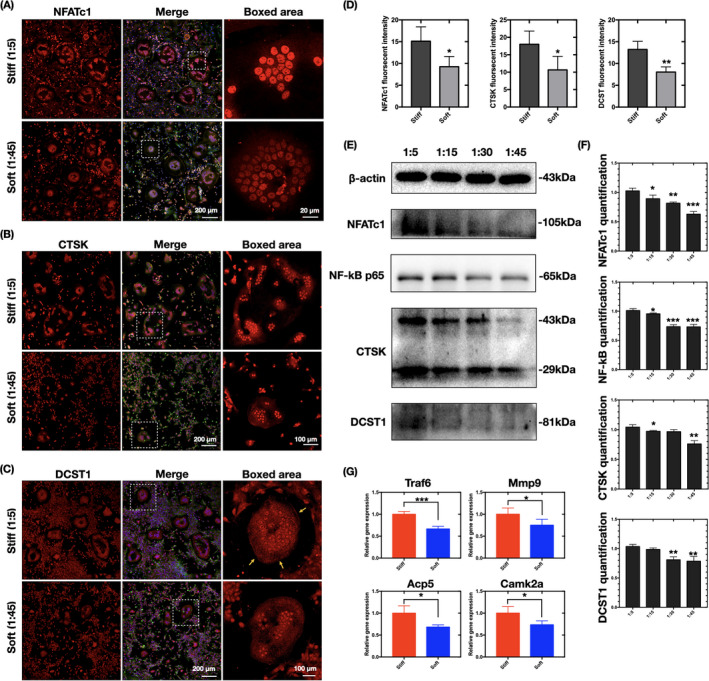
FIGURE 3.

Substrate stiffness regulates the expression profile of osteoclast‐specific markers. (A–C) CLSM image of immunofluorescence‐stained cells (n = 3 independent experiments) showing changes in the expression levels of NFATc1, CTSK, and DCST1 (by red stain) on PDMS substrates of different rigidity. The osteoclasts were counterstained for F‐actin (phalloidin, green) and nuclei (DAPI, blue). (D) ImageJ quantification of the fluorescence intensity in (A–C) (n = 10 cells per group). Data are the mean ±SD. *p < .05, **p < .01. (E) Western blot assay of NFATc1, NF‐κB p65, CTSK, and DCST1 levels in cells cultured on PDMS substrates of different rigidity (n = 3 independent experiments). (F) Quantification of NFATc1, NF‐κB p65, CTSK, and DCST1 in (F). Data are the mean ±SD. Significant difference relative to group (1:5). *p < .05, **p < .01, **p < .001. (G) qPCR analysis of Traf6, Mmp9, Acp5, and Camk2a expression levels in stiff (1:5) and soft (1:45) groups (n = 3 independent experiments). *p < .05, ***p < .001
